PRODUCTS
CHECKMK
CHECKMK
Everything monitored
Quickly gain a complete view of your IT infrastructure, no matter how complex. Checkmk provides powerful monitoring of networks, servers, clouds, containers and applications. Fast. Effective.
Monitor your entire hybrid IT infrastructure
Servers
Ensure that your server infrastructure is operating at peak performance. No more late nights and weekends!
Scalable server monitoring software for Sysadmins and DevOps
Ensure peak server performance for your infrastructure with the best server monitoring. Say goodbye to preventable outages, late nights, or weekend emergencies.
Reasons to choose Checkmk as your server monitoring tool
Compatible with almost anything
Checkmk supports the monitoring of almost every operating system: Linux, Windows, macOS, but also many other OS like BSD.
Ultra-scalable & Flexible
One Checkmk instance can monitor thousands of servers and can easily scale horizontally with our distributed monitoring setup.
Intelligent Monitoring

Checkmk intelligently discovers which metrics to monitor on your server without needing any additional configuration.
It’s fast to get started

Checkmk enables you to go from zero to monitoring in less than 15 minutes. Thus, the installation of your new server monitoring solution is super easy and fast!
Some of the vendors Checkmk support

Linux server monitoring
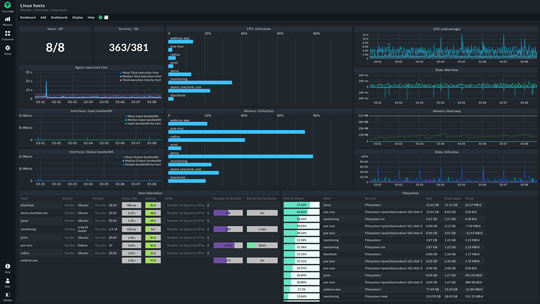
Get an accurate overview of your Linux servers’ health and performance. We support the following Linux OS: Debian, Ubuntu, Red Hat Enterprise Linux, Fedora, CentOS, openSUSE, SLES and other derivatives, as well as all other DEB-based distributions.
Benefits of Linux server monitoring with Checkmk:
- Minimal footprint (the agent requires little CPU, RAM or hard drive space)
- Full transparency (only a shell script is executed in which you can see all commands)
- Complete security (the agent permits no access from the network whatsoever)

Windows server monitoring
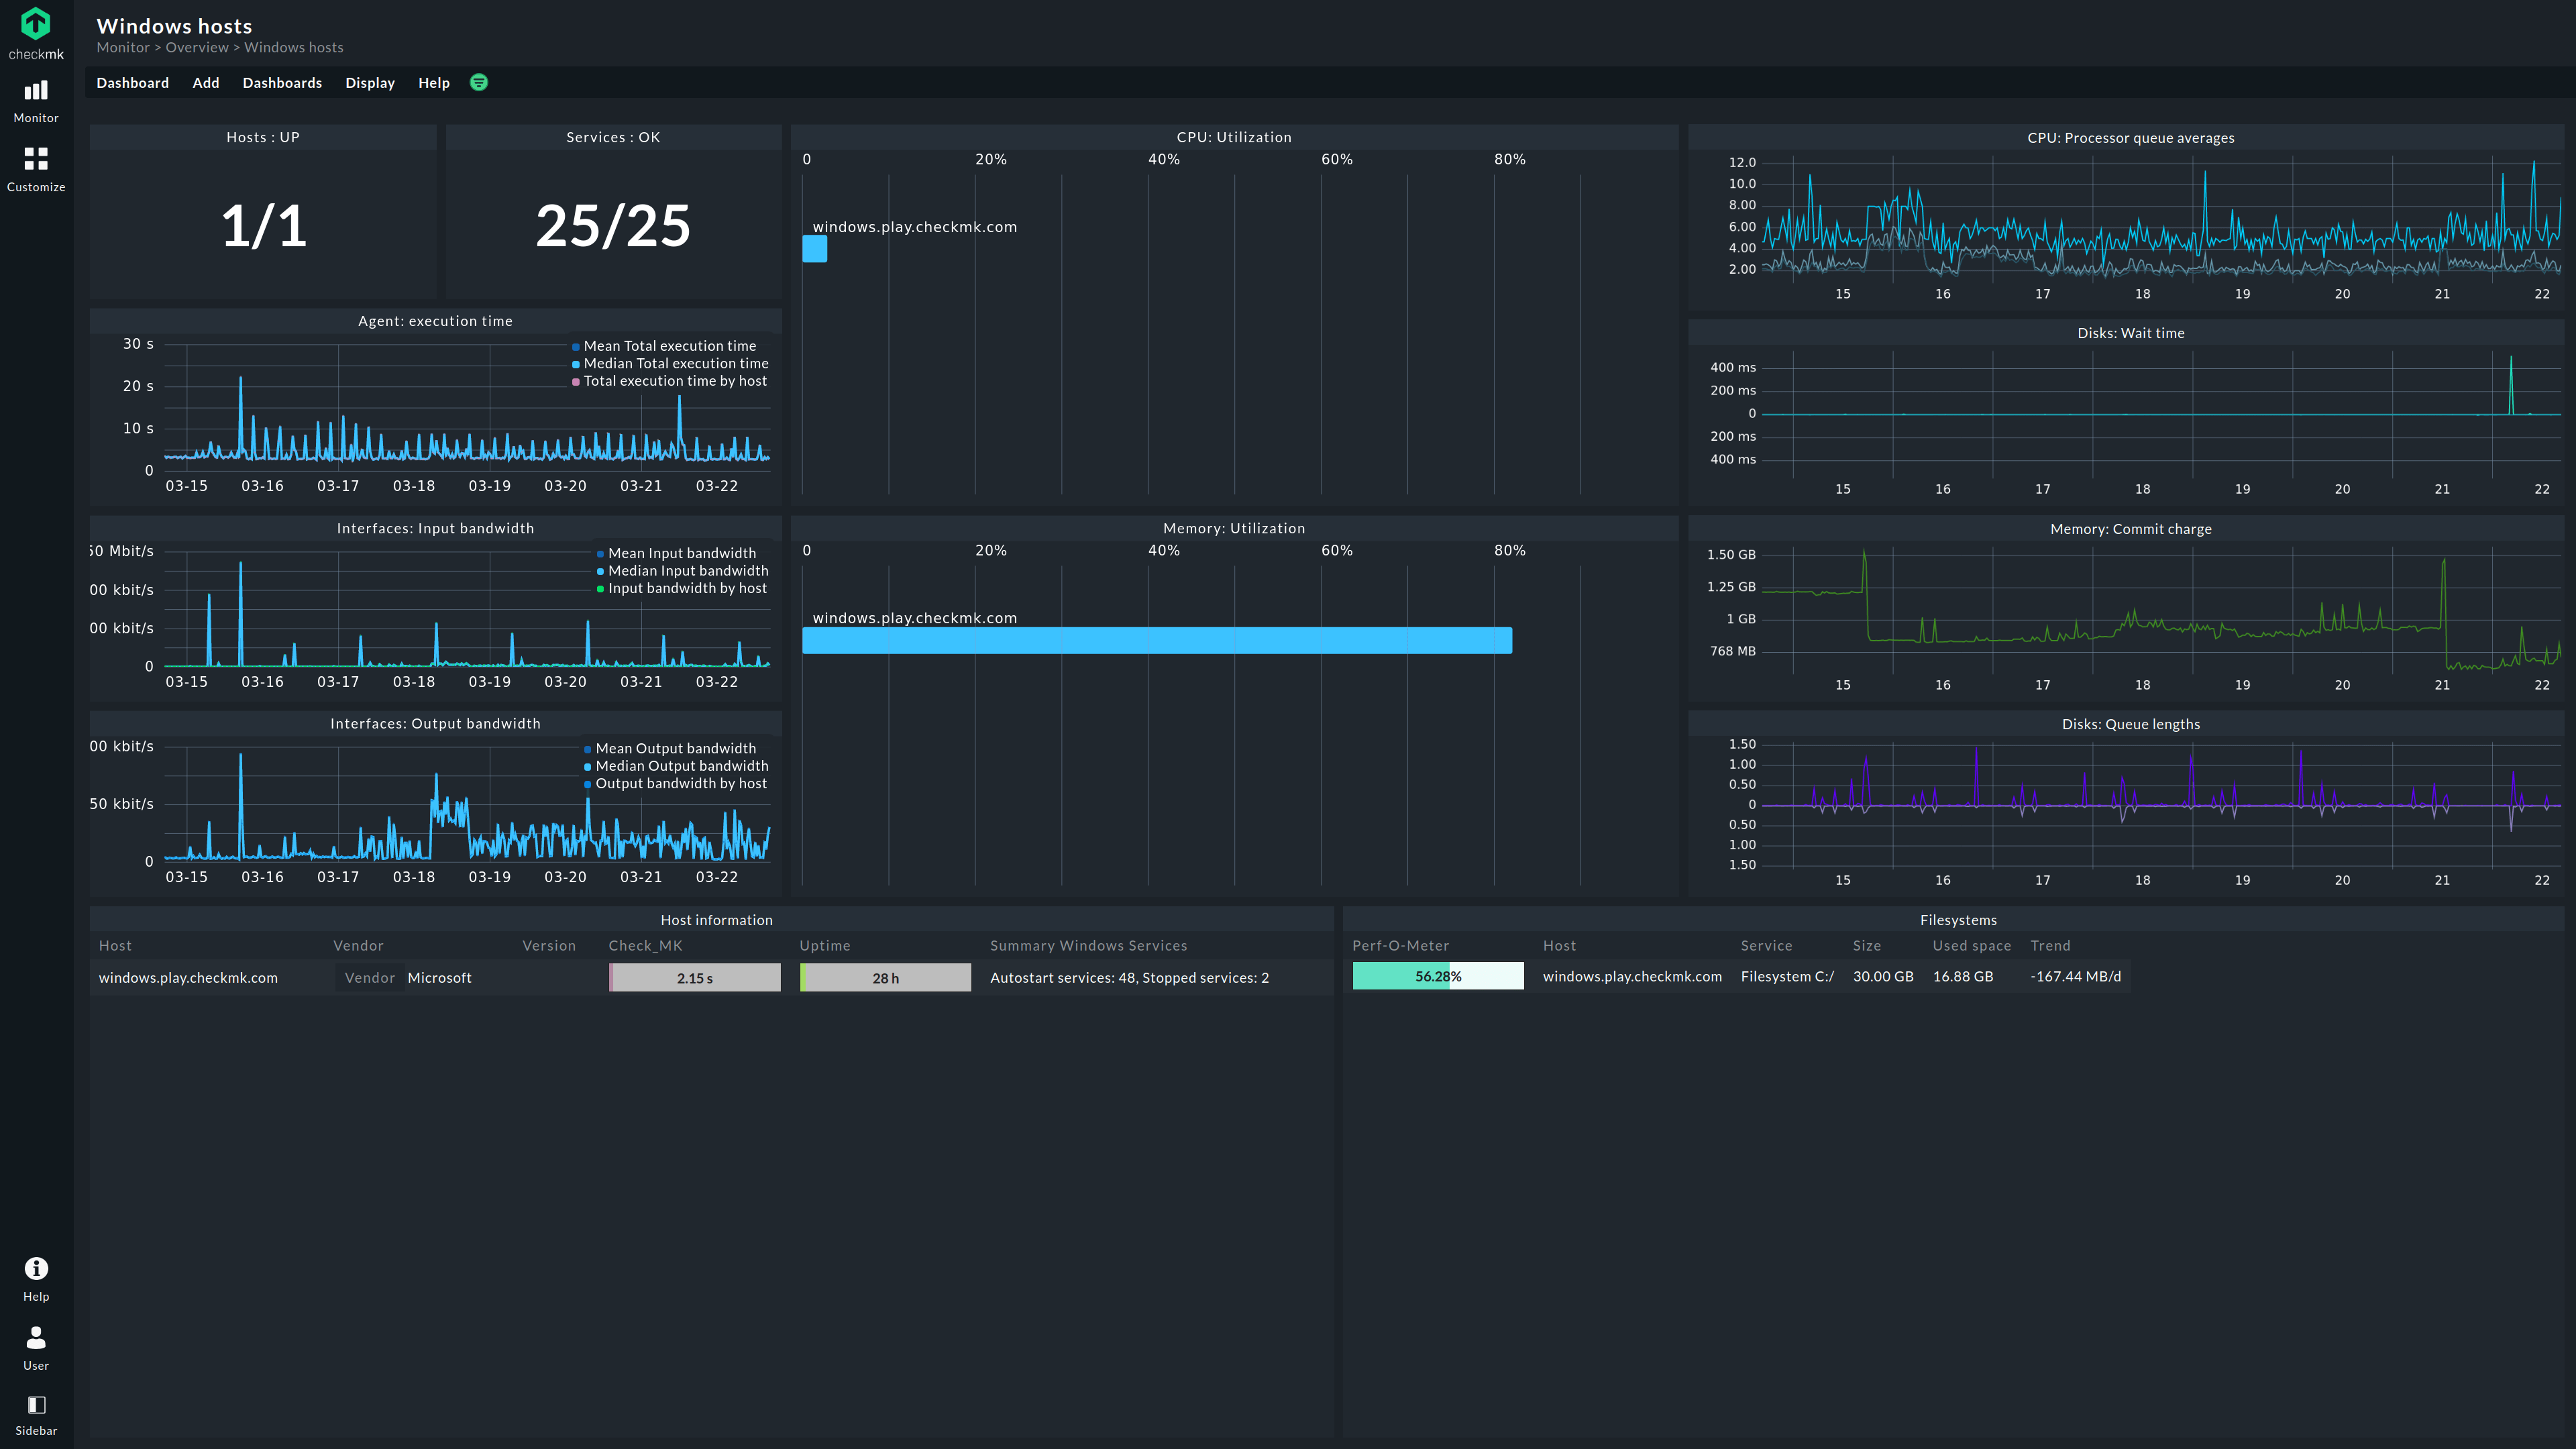
Monitor your Windows servers and gain insights into critical metrics such as CPU, memory, disk usage, services, processes, network interfaces, filesystems and more. Quickly identify and resolve any performance or availability issues.
Benefits of Windows server monitoring with Checkmk:
- Integrated log management for Windows Event Log
- Easily integrate monitoring for MS Exchange, Active Directory, MS SQL and Skype
- Monitor the latest Windows OS and older versions (Windows XP, Windows Server 2003 etc.)
- Use a simple executable file with no DLL dependencies (no risk of malicious code injection as the agent doesn’t read data from the network)
Windows server monitoring
Monitor your Windows servers and gain insights into critical metrics such as CPU, memory, disk usage, services, processes, network interfaces, filesystems and more. Quickly identify and resolve any performance or availability issues.
Benefits of Windows server monitoring with Checkmk:
- Integrated log management for Windows Event Log
- Easily integrate monitoring for MS Exchange, Active Directory, MS SQL and Skype
- Monitor the latest Windows OS and older versions (Windows XP, Windows Server 2003 etc.)
- Use a simple executable file with no DLL dependencies (no risk of malicious code injection as the agent doesn’t read data from the network)

Virtual server monitoring
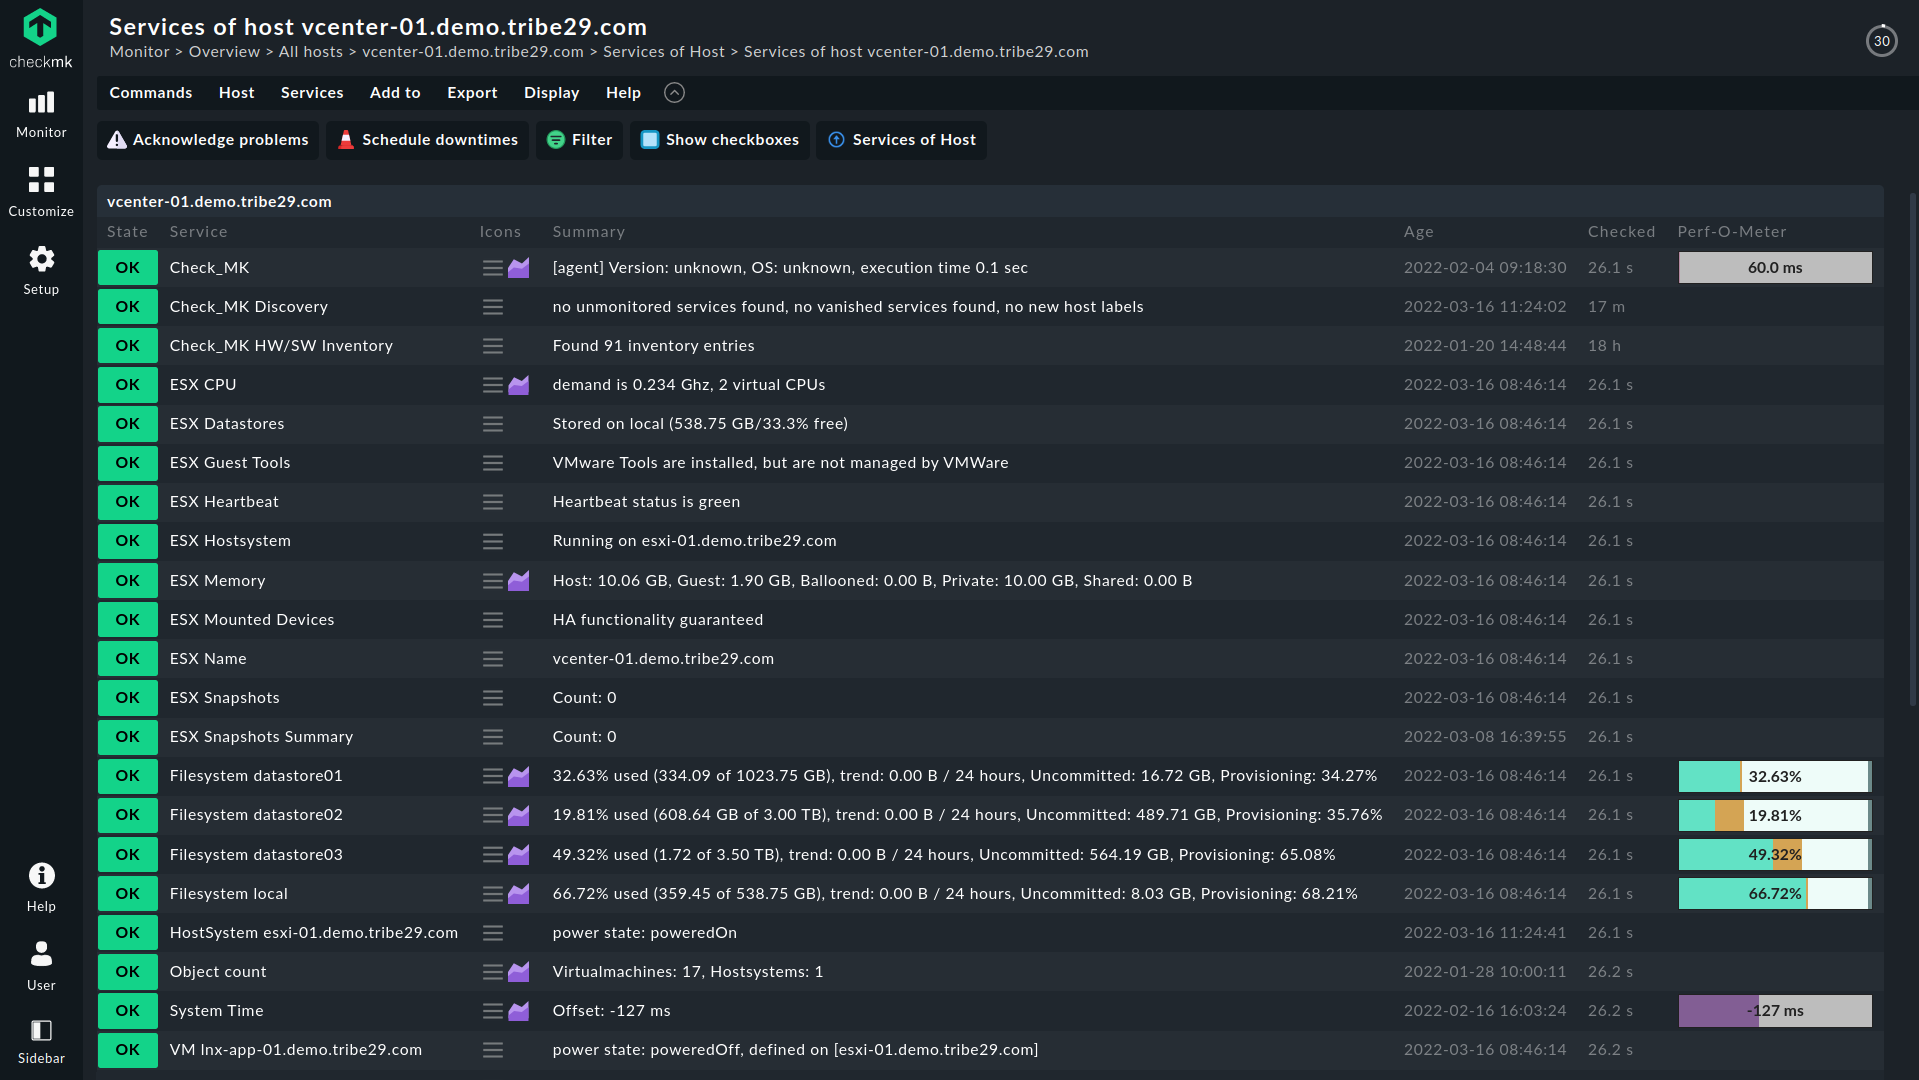
Monitor the health and availability of your virtualized server environment. Checkmk supports the real-time monitoring of all major virtualization platforms, such as VMware ESXi, Microsoft Hyper-V and associated virtual machines.
Virtual server monitoring is already integrated in Checkmk, so that your virtual machines can be monitored with almost no additional set-up. Checkmk itself can also be run on a virtual server infrastructure within the virtual appliance.

Networks
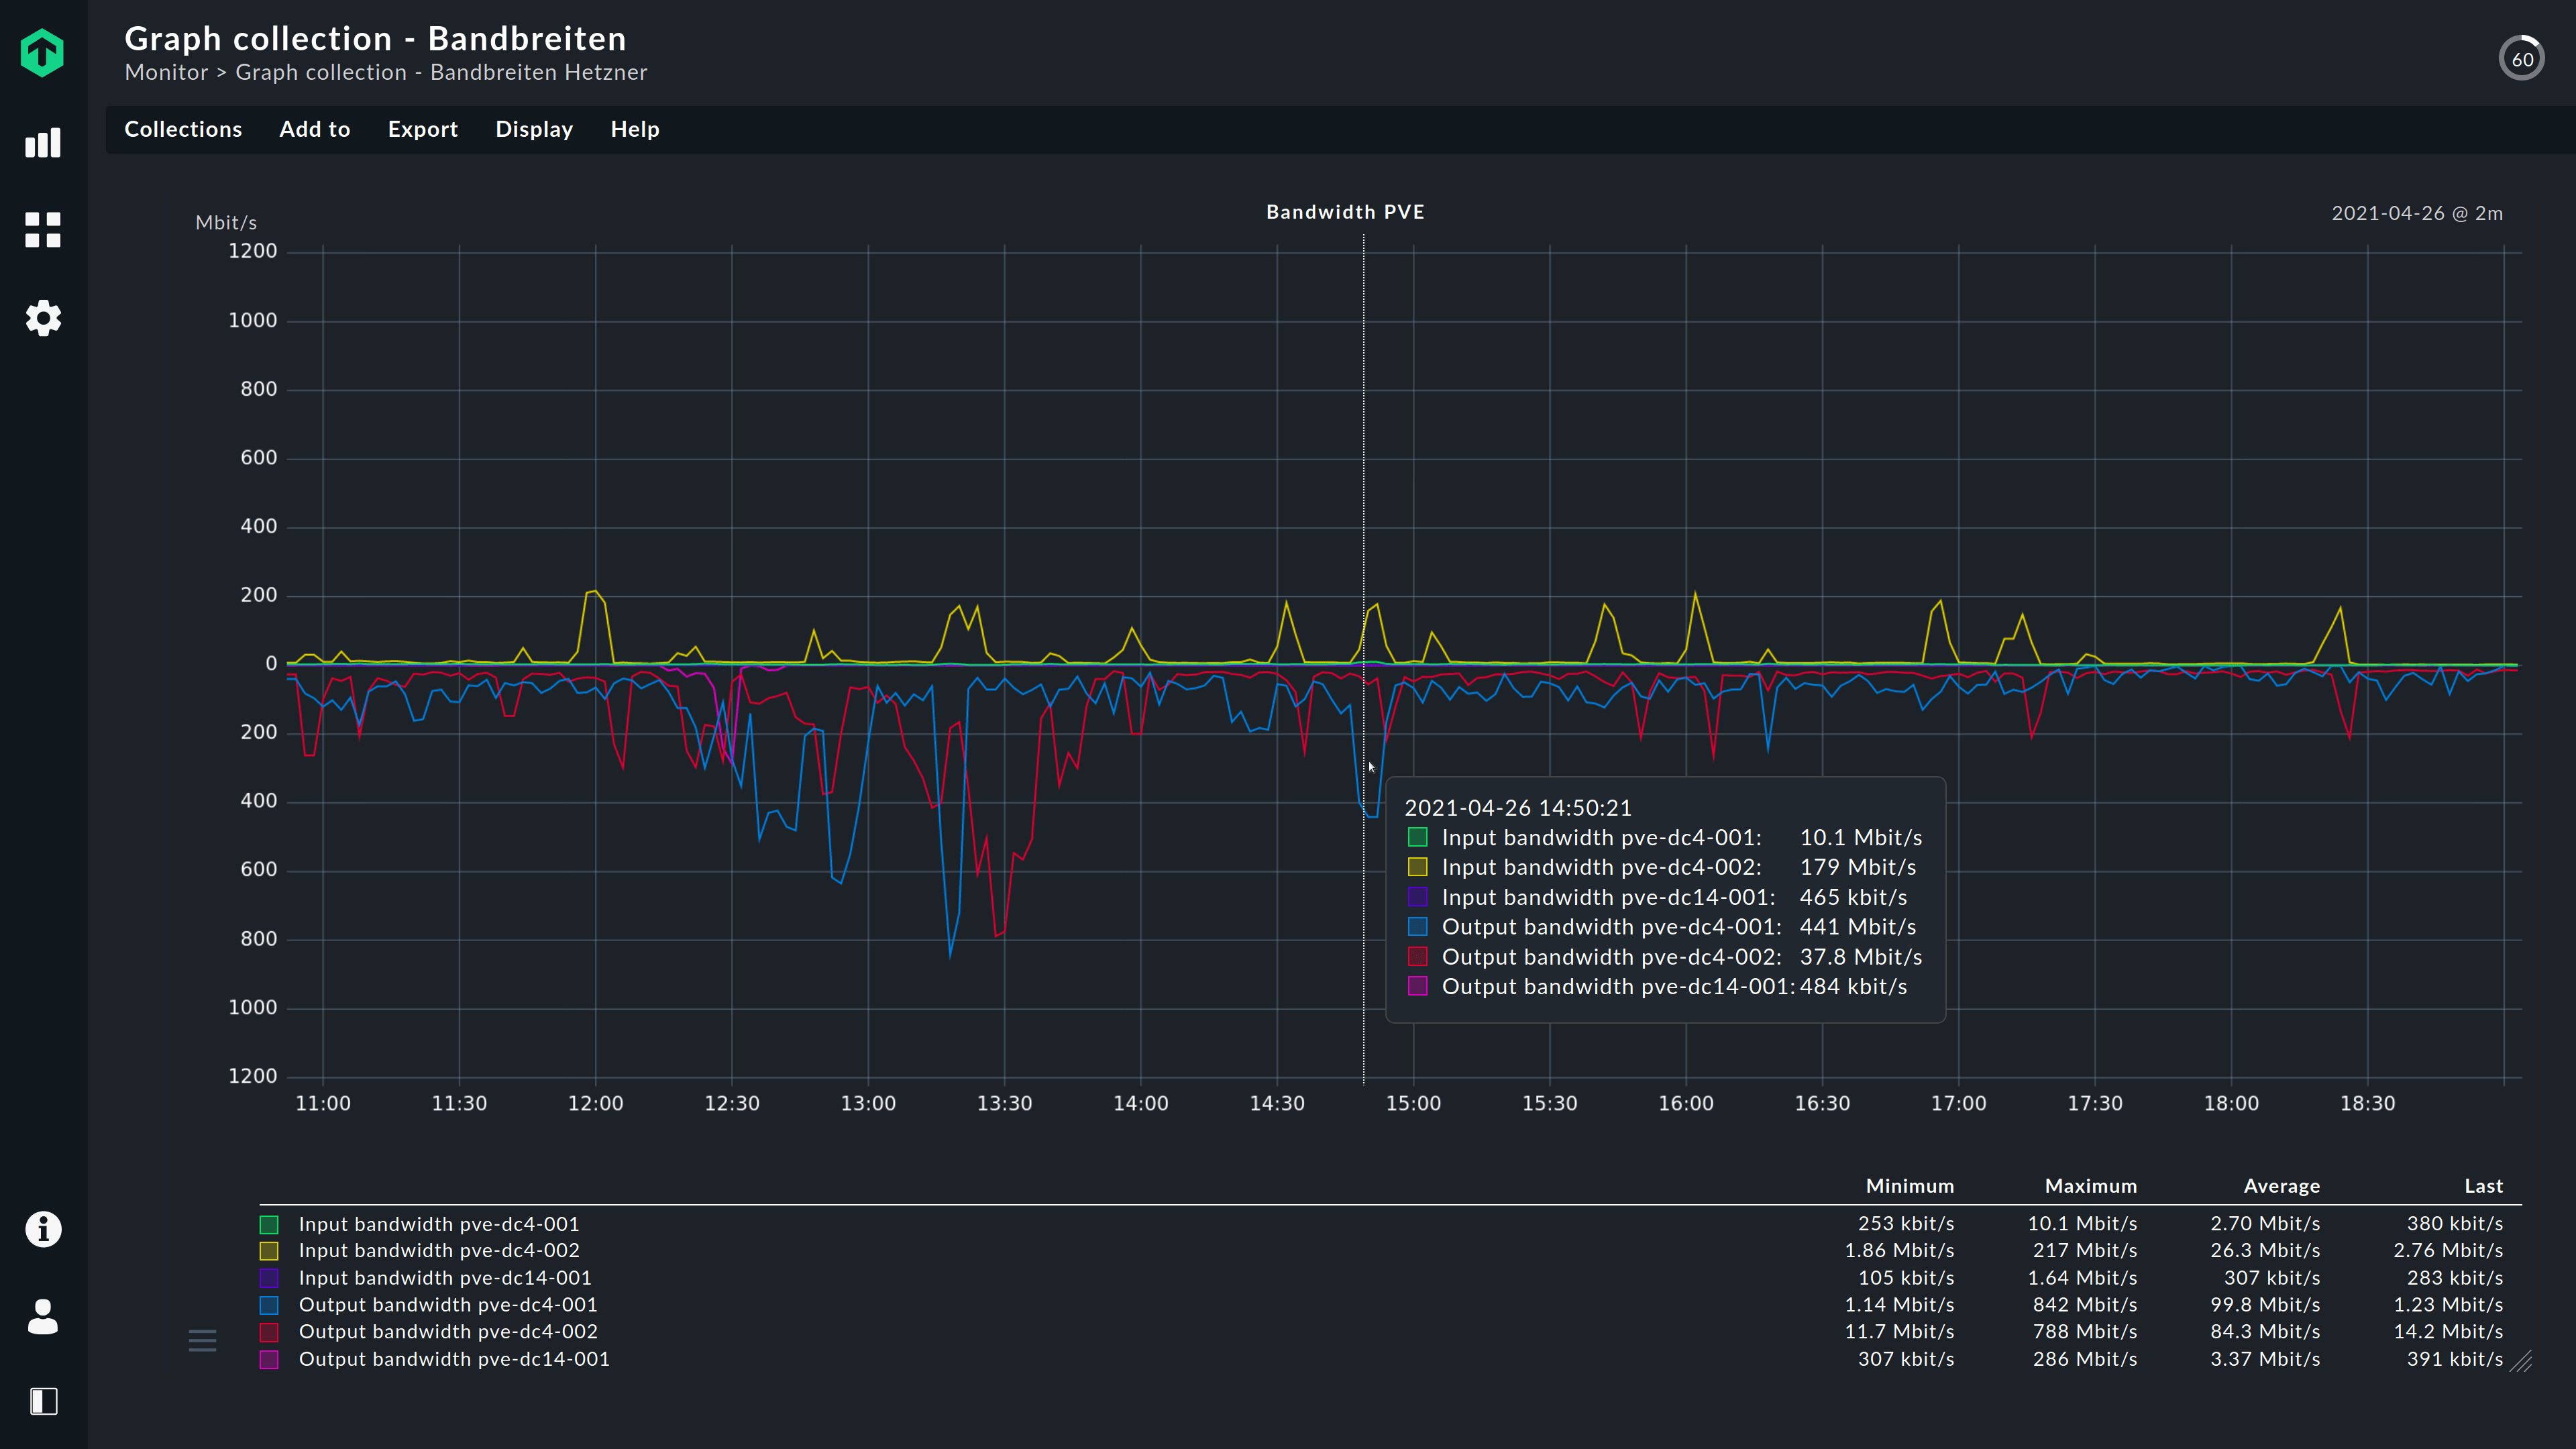
Reduce downtime in your network with the network monitoring of Checkmk and discover hidden issues impacting the bandwidth to ensure maximum productivity for your users.
Networks
Reduce downtime in your network with the network monitoring of Checkmk and discover hidden issues impacting the bandwidth to ensure maximum productivity for your users.
Some of the vendors Checkmk support

An easy to set-up holistic network monitoring software
Your whole business depends on an efficiently-functioning network infrastructure. However, even networks in small companies can get hugely complicated over time and it is easy to lose the overview and have difficulty keeping an eye on everything. A good network monitoring software can help to handle this issues.
Checkmk as a network monitoring tool can help you quickly monitor your entire network and it doesn’t cover only the major devices, but also a broad range of vendors — even those outside the mainstream. And this all without complicated configurations and endless alarms. With a few clicks, you will be able with this network monitoring tool to monitor all your network devices, e.g.:
- Switches & Routers — Monitor packet rates, error rates, the state and bandwidth of ports, error rates, CPU utilization, fans, power supply, temperature and more. Supported devices for network monitoring include, e.g. Alcatel-Lucent, Cisco, Brocade, Dell, Enterasys, Extreme Networks, Huawei, Intel, Juniper, TP-Link.
- Wireless — Also monitor your wireless networks, e.g. state of access points, signal strength and connected devices for Aerohive, Aruba Networks, CBL, MikroTik, Netgear, Fritz!Box, etc., devices.
- Firewalls — Ensure the security of your network by monitoring the health, VPN tunnel state, high availability state and more of your BlueCat, Checkpoint, F5, FireEye, FortiGate, IBM, Palo Alto Networks, etc., devices.
Ultra efficient network monitoring
Checkmk uses a rules-based concept for configuring your network monitoring. This becomes especially powerful when monitoring a large number of similar devices, in contrast to a template-based approach, in which you need to configure each ‘sensor’.
With just a couple of rules you can configure your entire network monitoring, e.g. monitoring only the error rate for access ports. Routers and switches can have several hundred SNMP messages – it is important to monitor only what really matters. Checkmk knows what data matters, and filters the data for you so that you get to see the data you actually need in your network monitoring.

For small networks and ISPs
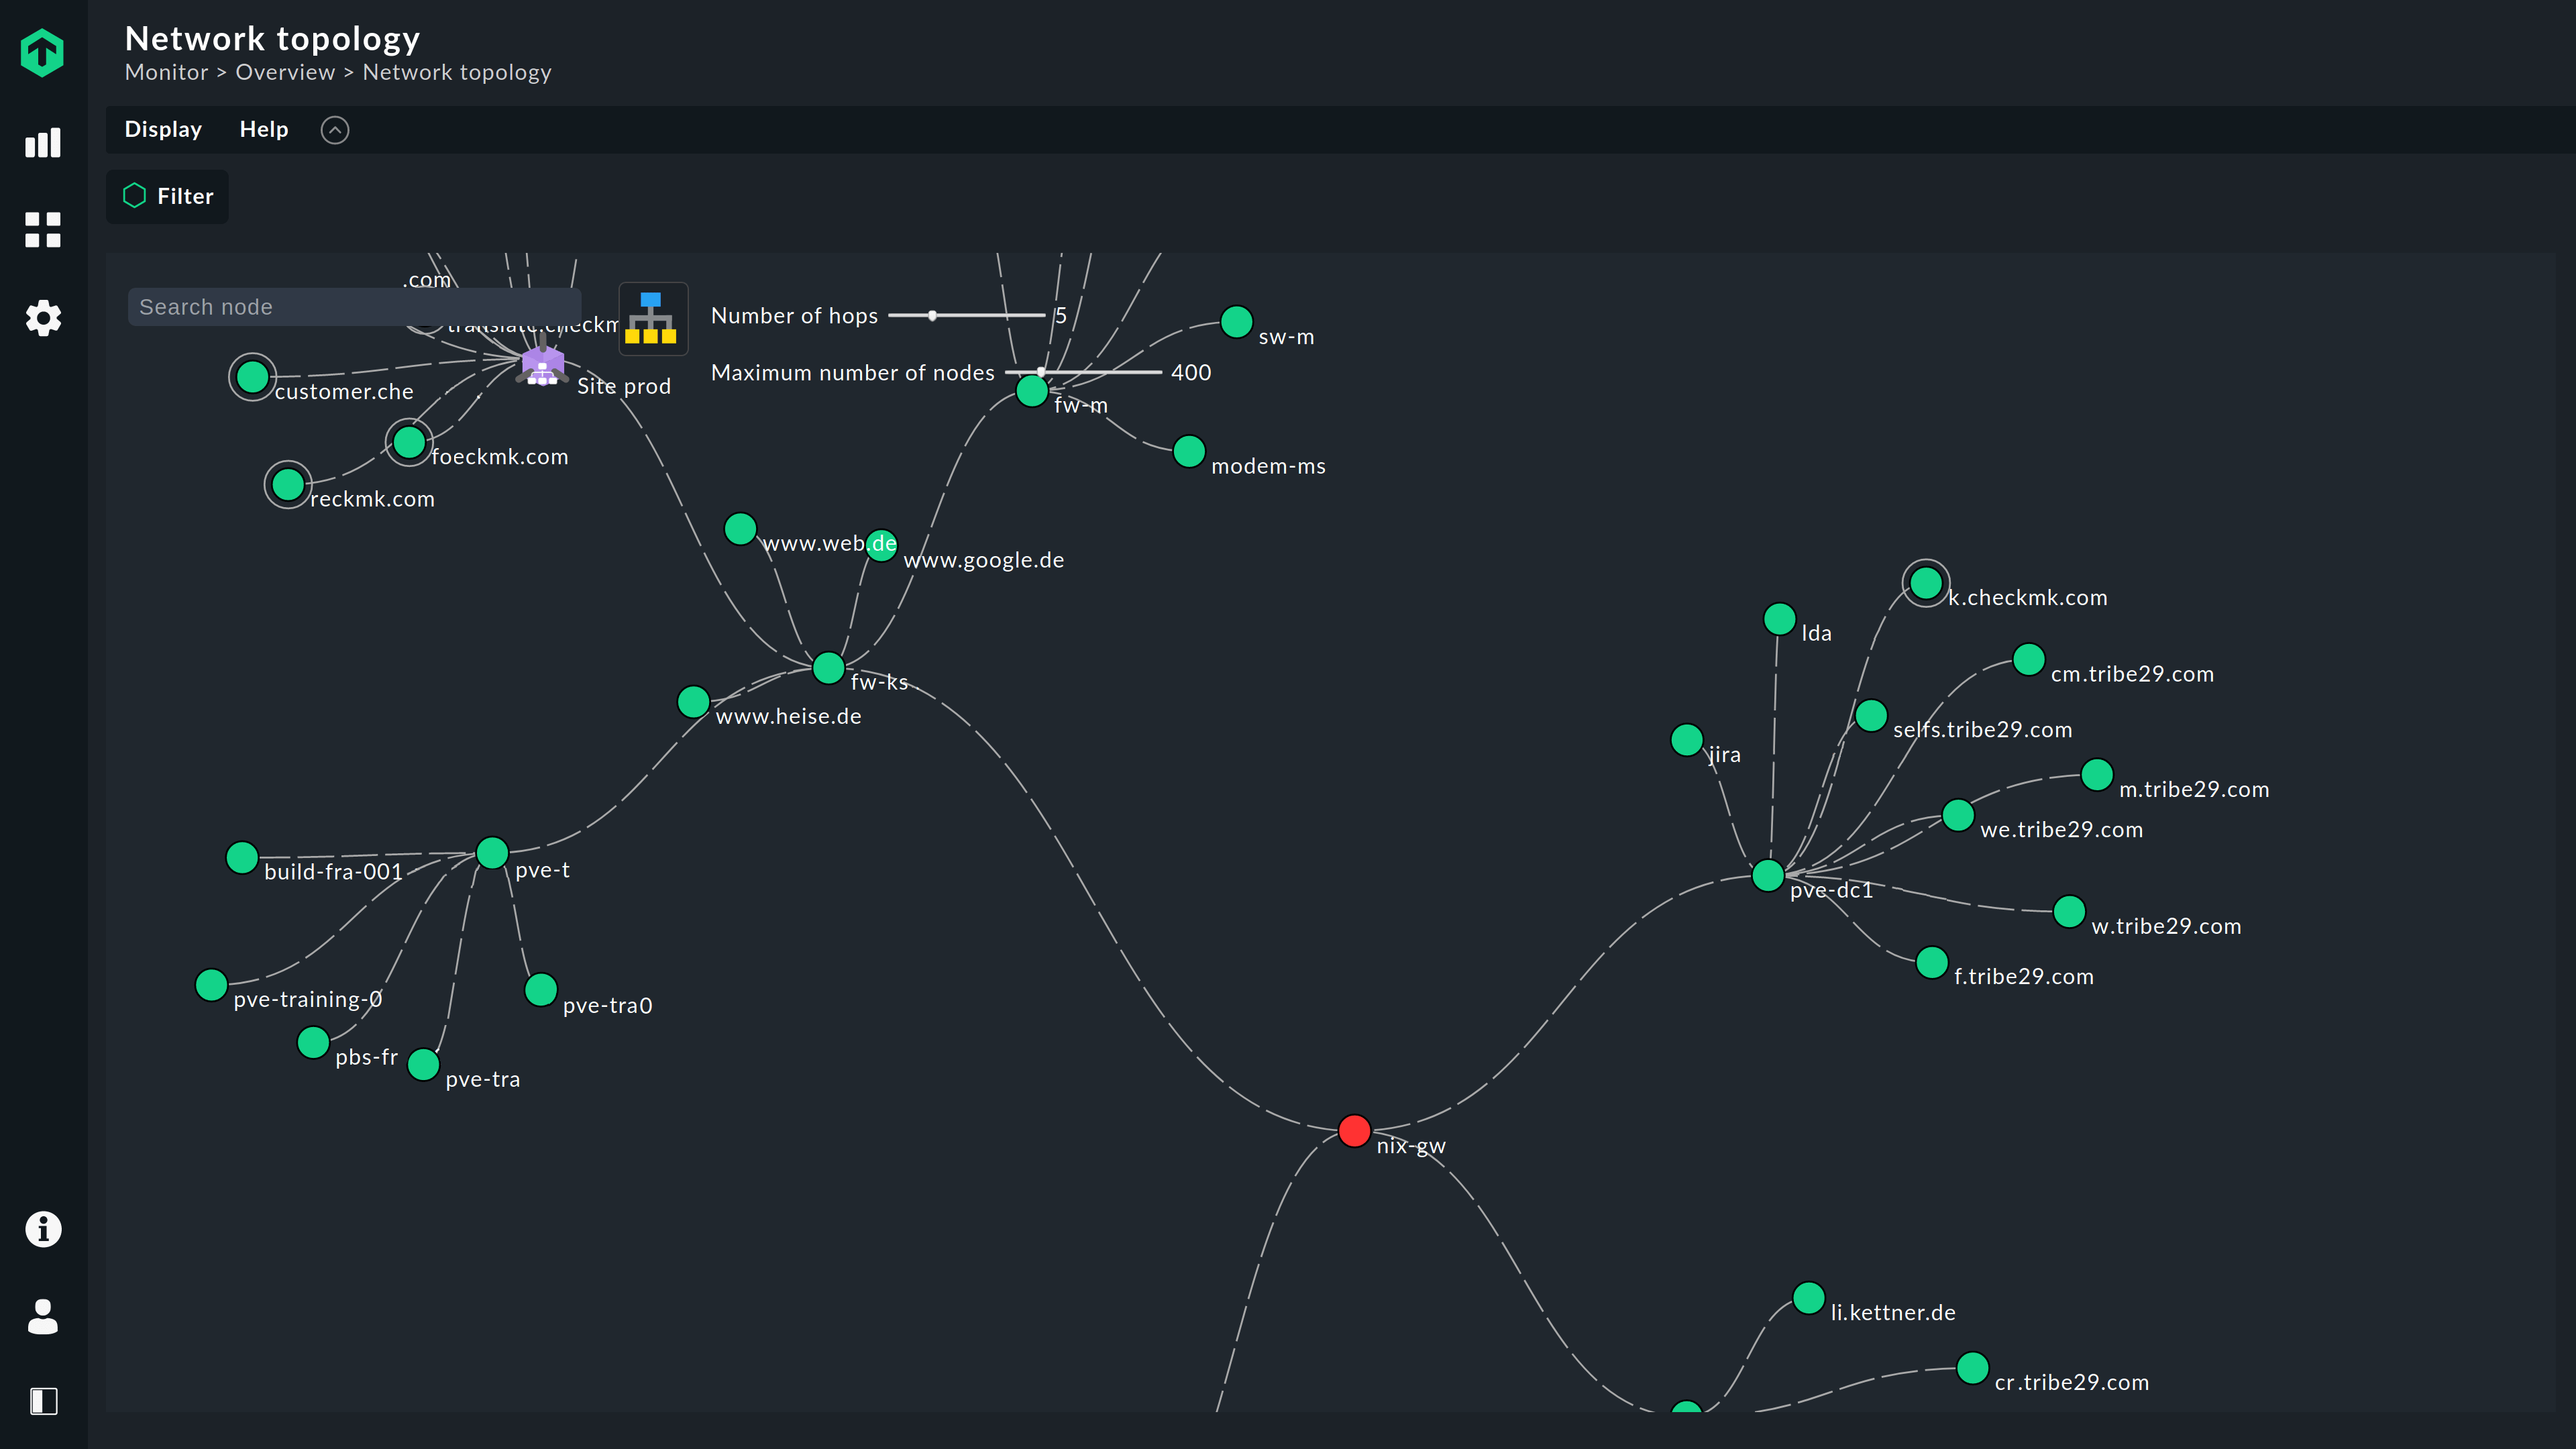
Checkmk comes with more than 1,800 preconfigured checks and it is highly likely that it can monitor any switch, router or firewall you may have.
You can monitor the network interfaces of low-end switches with just a couple of ports. But you can also monitor huge core switches with several hundred ports or the devices powering the internet — monitor BGP sessions, routing engines, fans, memory, file systems and more for your BGP routers.

Network flow monitoring
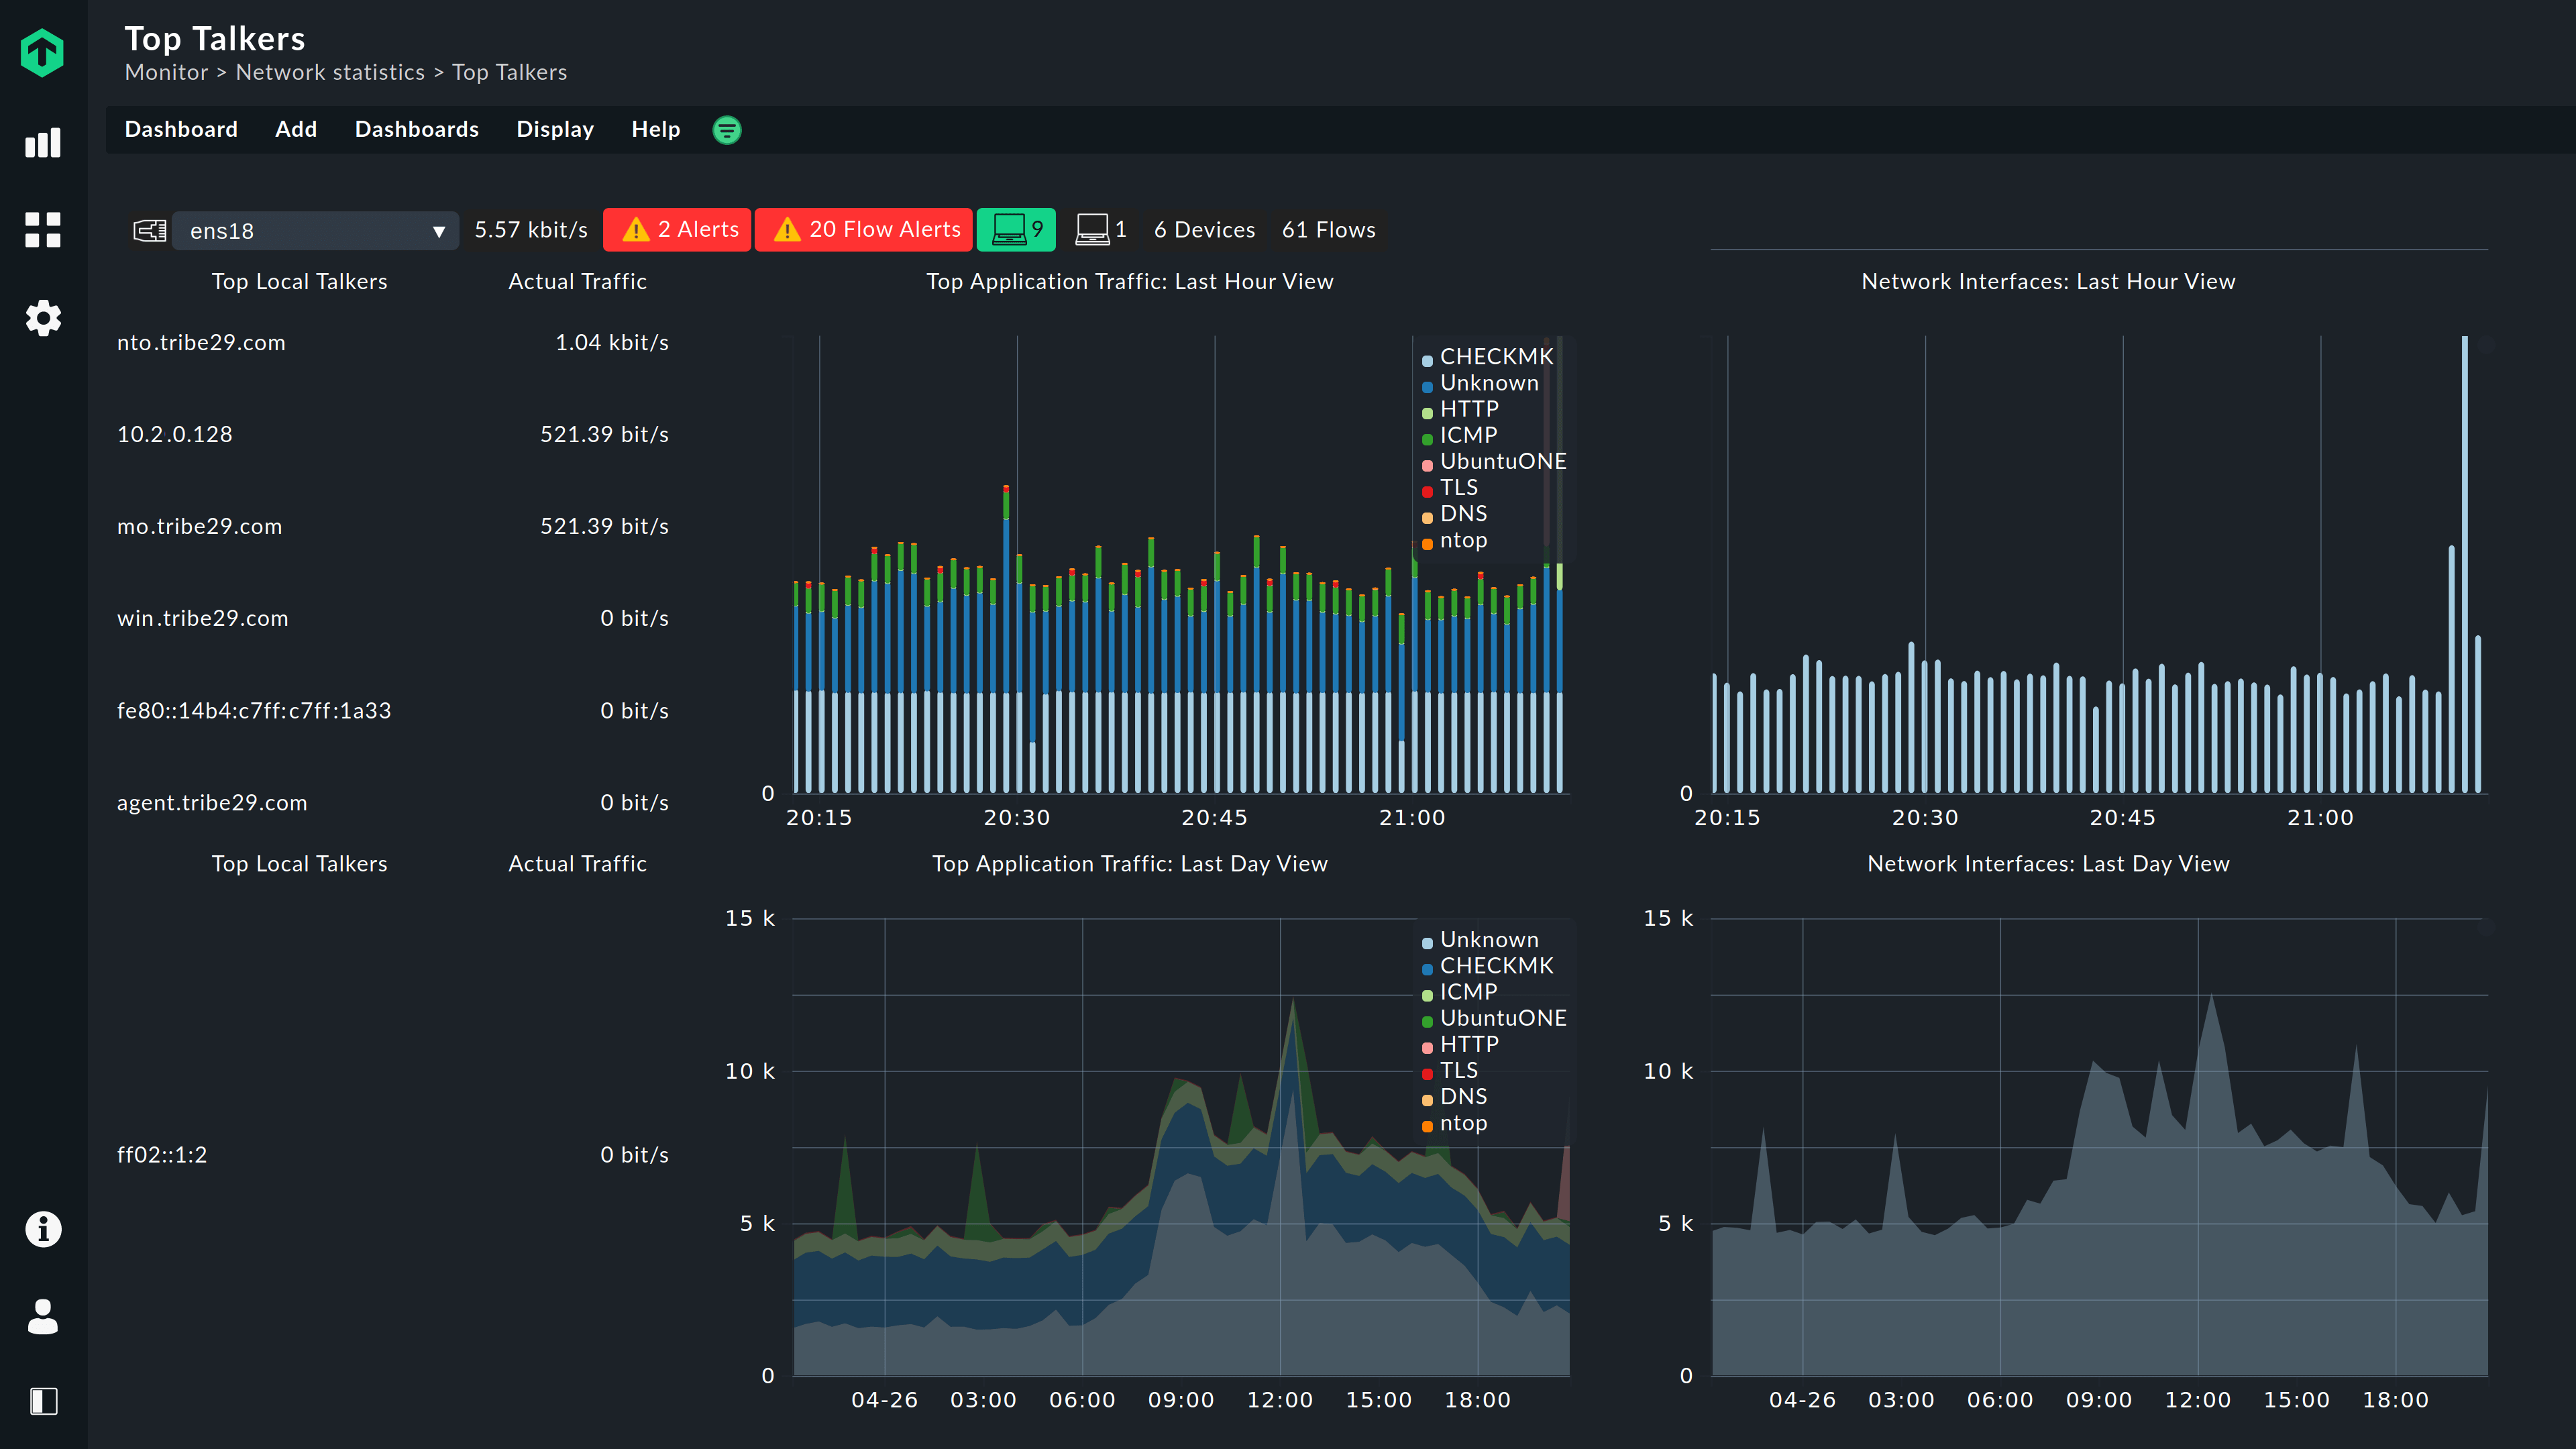 In addition to comprehensive network monitoring, the Checkmk Enterprise Edition starting from version 2.0 optionally supports monitoring of network flows. Checkmk is able to integrate network flow data provided by ntop and allows you to get an even more detailed monitoring of your network. You can analyse your network traffic in-depth without having to leave the Checkmk interface.
By analyzing flow data, you can learn which hosts, applications, or protocols are communicating with each other. This allows you to break down network usage per host, destination address, protocol, or application to see what the top talkers and top listeners are on your network. In addition, network flow monitoring helps you detect bottlenecks or anomalies in your network infrastructure.
With Checkmk you have all the data in your Checkmk main dashboard. Checkmk gets all the information from ntop. Furthermore, you can view all flow information and analyze all flow-specific alarms via the alert dashboard. In addition, the flow data provides you with supplementary information on each host, such as traffic packets, ports, peers and applications.
Network flow monitoring
In addition to comprehensive network monitoring, the Checkmk Enterprise Edition starting from version 2.0 optionally supports monitoring of network flows. Checkmk is able to integrate network flow data provided by ntop and allows you to get an even more detailed monitoring of your network. You can analyse your network traffic in-depth without having to leave the Checkmk interface.
By analyzing flow data, you can learn which hosts, applications, or protocols are communicating with each other. This allows you to break down network usage per host, destination address, protocol, or application to see what the top talkers and top listeners are on your network. In addition, network flow monitoring helps you detect bottlenecks or anomalies in your network infrastructure.
With Checkmk you have all the data in your Checkmk main dashboard. Checkmk gets all the information from ntop. Furthermore, you can view all flow information and analyze all flow-specific alarms via the alert dashboard. In addition, the flow data provides you with supplementary information on each host, such as traffic packets, ports, peers and applications.

Understanding switch port usage
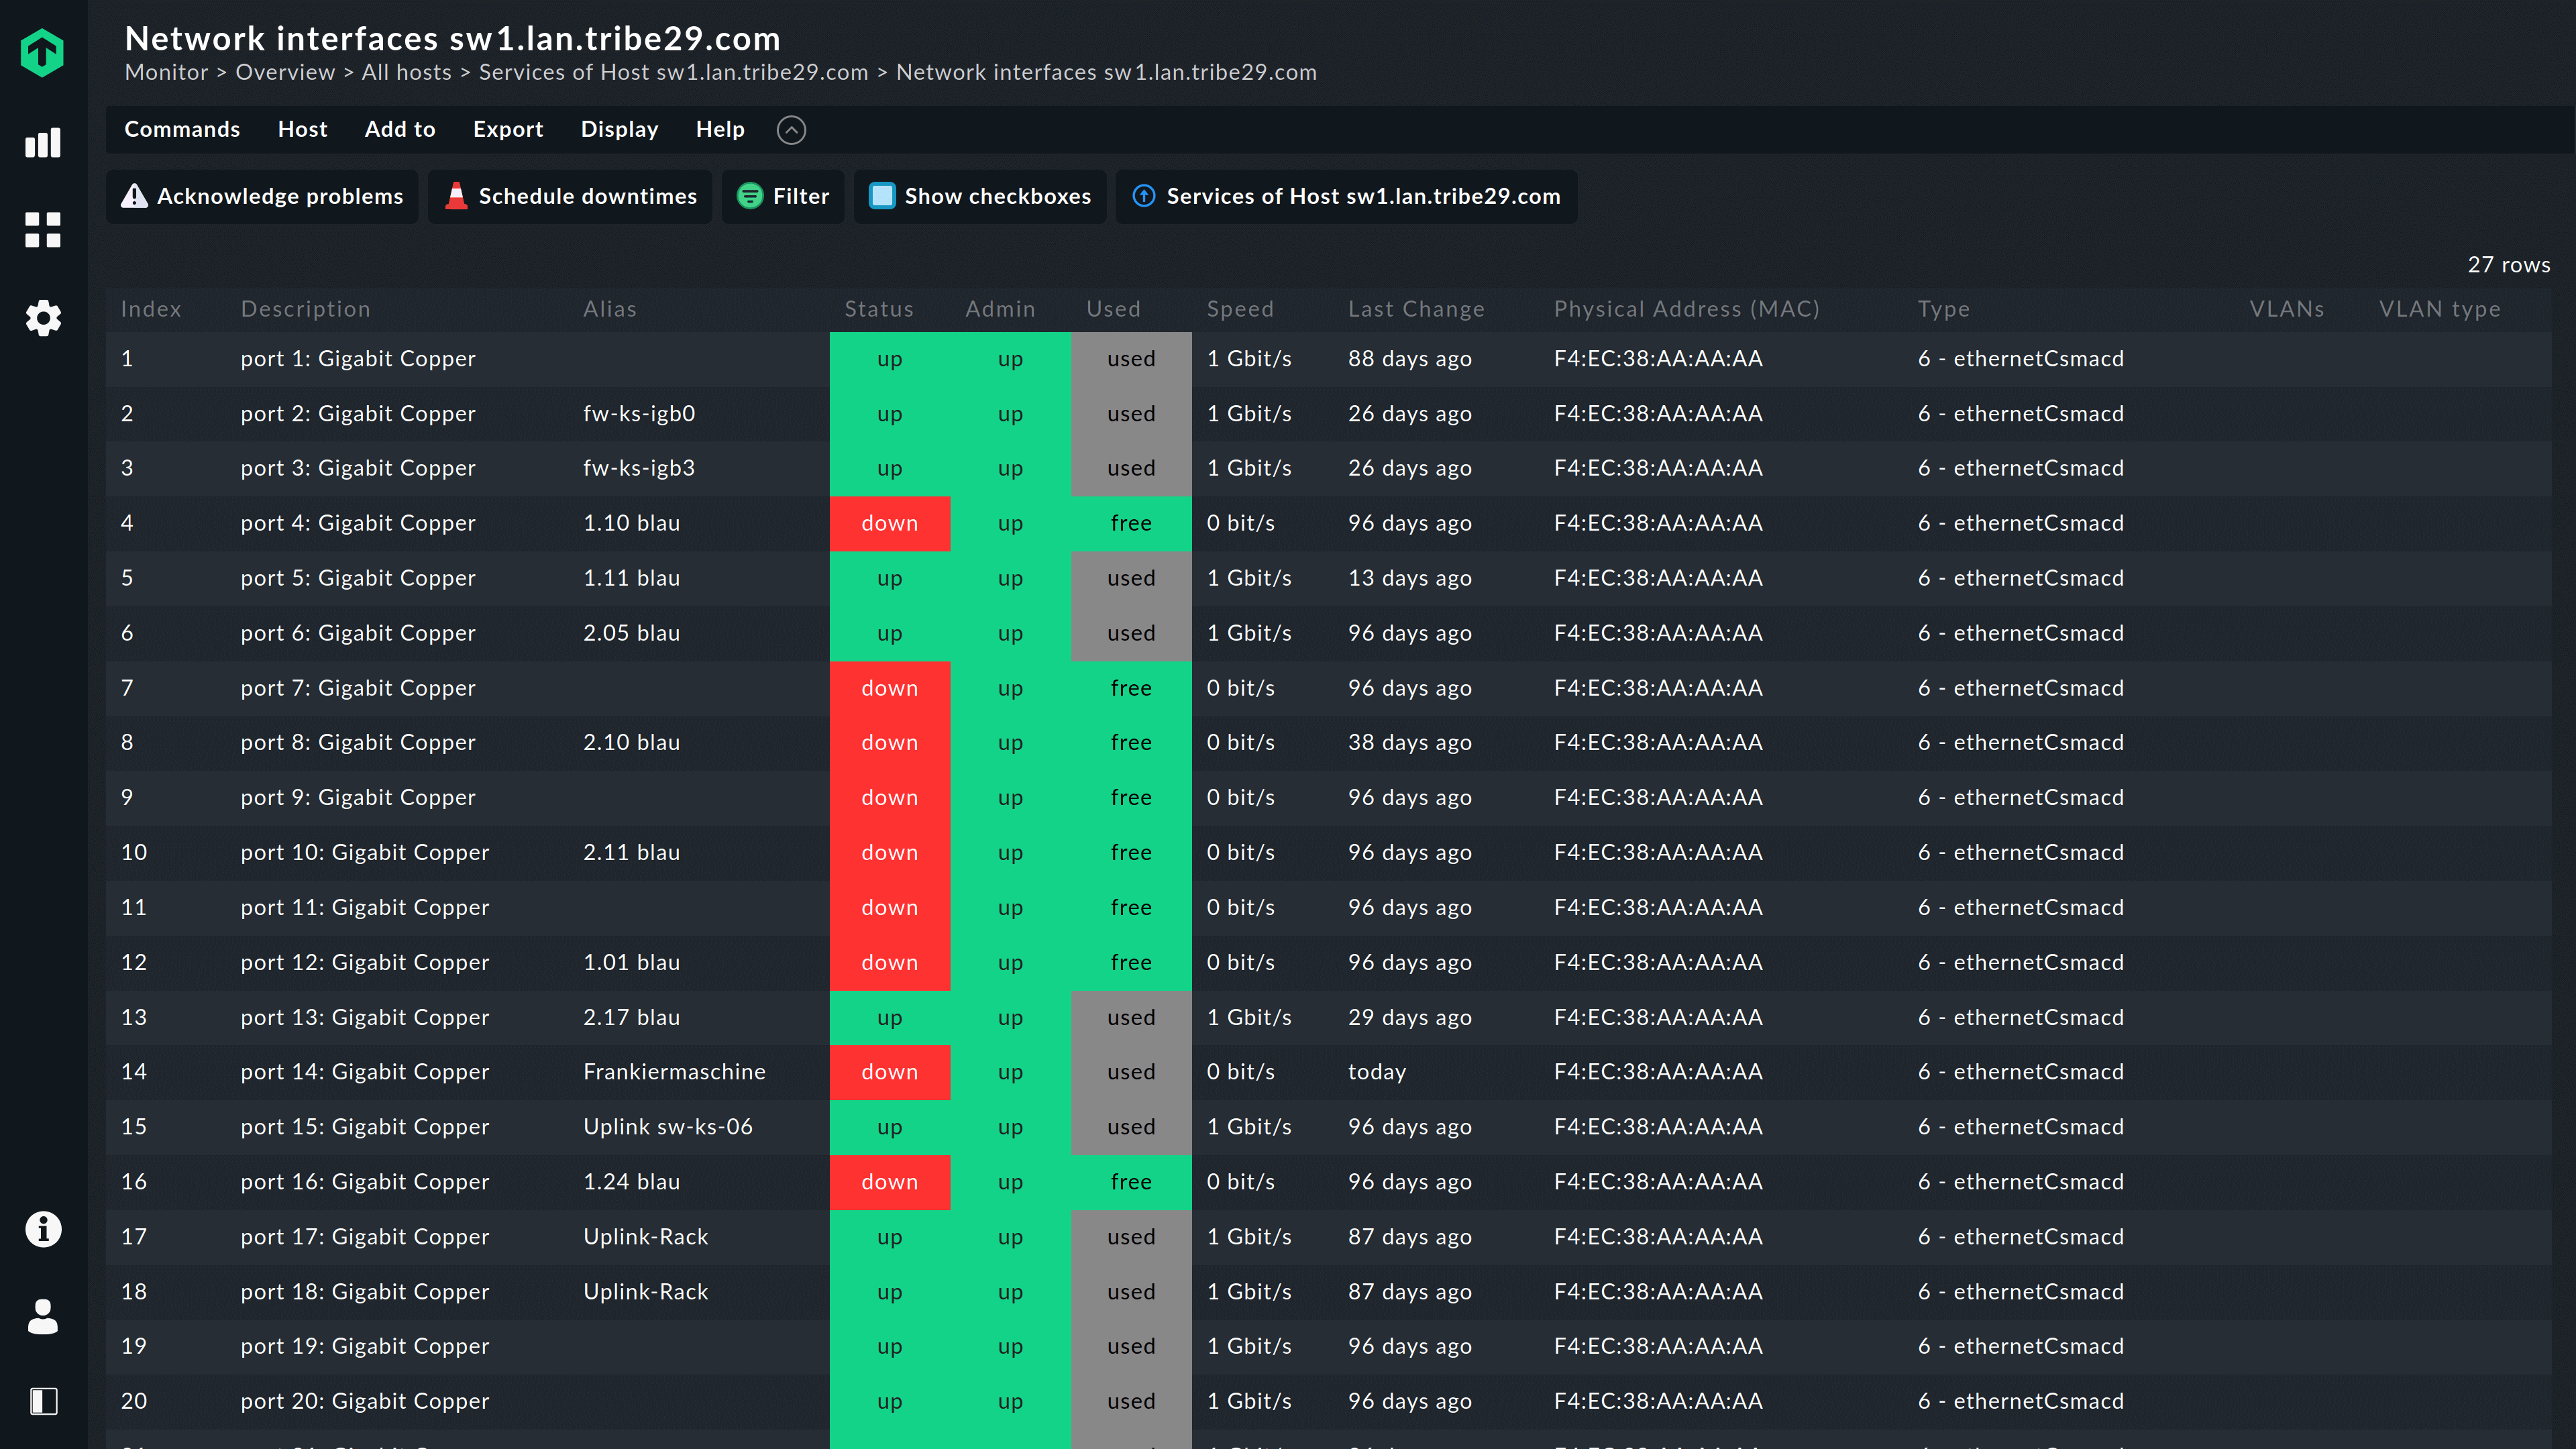
Have you ever stood in front of a switch and wondered which ports are actually being used, and which not, or that someone hasn’t simply removed a cable? Have you ever unplugged your CEO from the internet because the port looked as if it was not in use, but he was in fact just on a business trip?
Checkmk combines real-time data and historic data in its network monitoring to understand which of a switch’s ports are in use. With the switch port statistics feature, you can see immediately which port is up/down/free, the speed, whether it is currently being used, and the last time when it was in use.

VPN and remote workplace monitoring
 Avoid capacity bottlenecks, bandwidth and performance issues, or configuration errors from slowing down your VPN and remote workplace architecture. This is the only way to ensure that your employees can easily access the tools and applications they need from home or wherever they work.
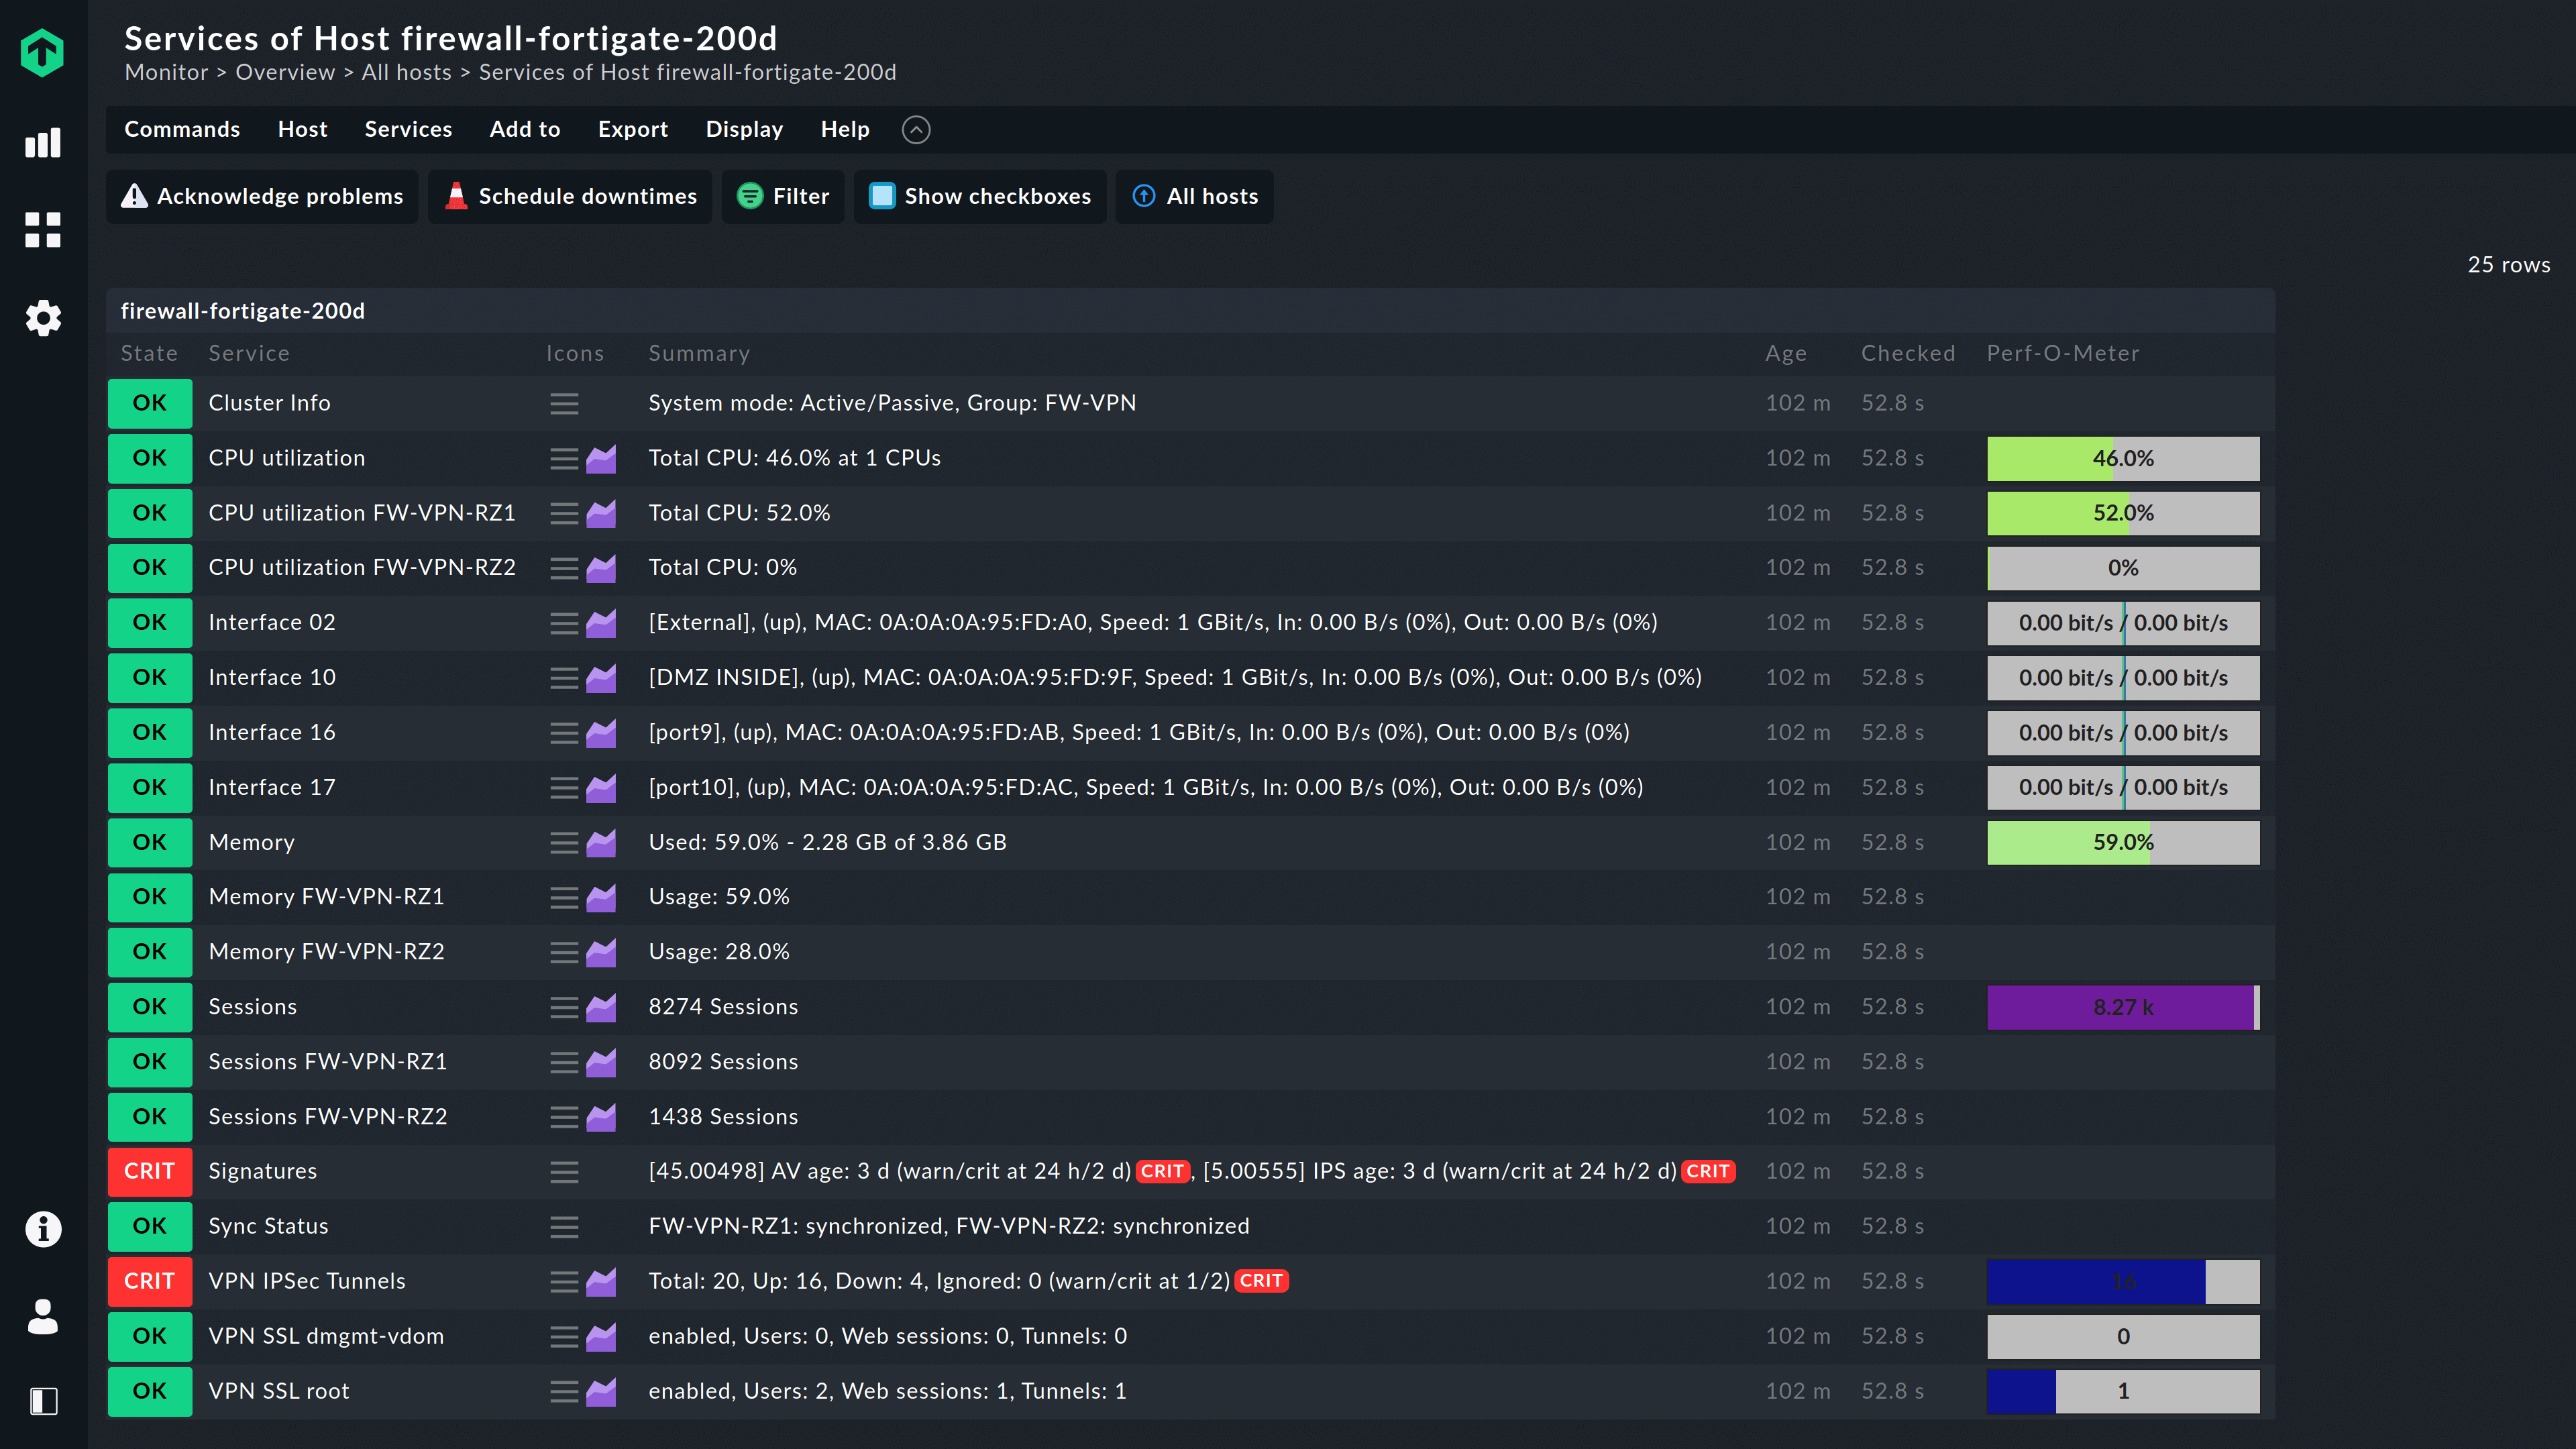
With Checkmk as your network monitoring software you are able to monitor the status and the number of your active VPN tunnels and the number of bytes being transferred via VPN, so that you can detect problems early and guarantee secure remote access to your company infrastructure at any time.
Prevent your VPN gateway from becoming a bottleneck in your remote architecture by easily monitoring device CPU usage with Checkmk. In this way Checkmk helps you to react to possible bottlenecks at an early stage.
With remote workplaces it is useful to monitor several parameters simultaneously to ensure smooth operation. Here, too, you should always keep an eye on the performance utilization of your gateway. Checkmk also helps you to keep an eye on the resource capacities of your virtual platform. Only if sufficient CPU, RAM or Storage IO are available, can a smooth operation and a possible scaling of the virtual workstations be guaranteed.
VPN and remote workplace monitoring
Avoid capacity bottlenecks, bandwidth and performance issues, or configuration errors from slowing down your VPN and remote workplace architecture. This is the only way to ensure that your employees can easily access the tools and applications they need from home or wherever they work.
With Checkmk as your network monitoring software you are able to monitor the status and the number of your active VPN tunnels and the number of bytes being transferred via VPN, so that you can detect problems early and guarantee secure remote access to your company infrastructure at any time.
Prevent your VPN gateway from becoming a bottleneck in your remote architecture by easily monitoring device CPU usage with Checkmk. In this way Checkmk helps you to react to possible bottlenecks at an early stage.
With remote workplaces it is useful to monitor several parameters simultaneously to ensure smooth operation. Here, too, you should always keep an eye on the performance utilization of your gateway. Checkmk also helps you to keep an eye on the resource capacities of your virtual platform. Only if sufficient CPU, RAM or Storage IO are available, can a smooth operation and a possible scaling of the virtual workstations be guaranteed.

Applications
Detect scalability issues, resource hogs, and other performance-related issues and fix them proactively.
In-depth, scalable application monitoring
Ensure maximum productivity for the people using your applications. Make sure your applications are always running at maximum performance. Say goodbye to preventable outages, late nights or weekend emergencies.
Some of the vendors Checkmk support

An all-in-one application monitoring software
The people in your organization rely on applications to do their daily job. Monitoring these desktop applications or web apps is key to ensure that the business you are responsible for keeps running smoothly.
Checkmk provides this flexibility through its large collection of 1,800+ plug-ins. Here are some examples of applications which can be monitored with Checkmk:
Increasing the availability of your applications
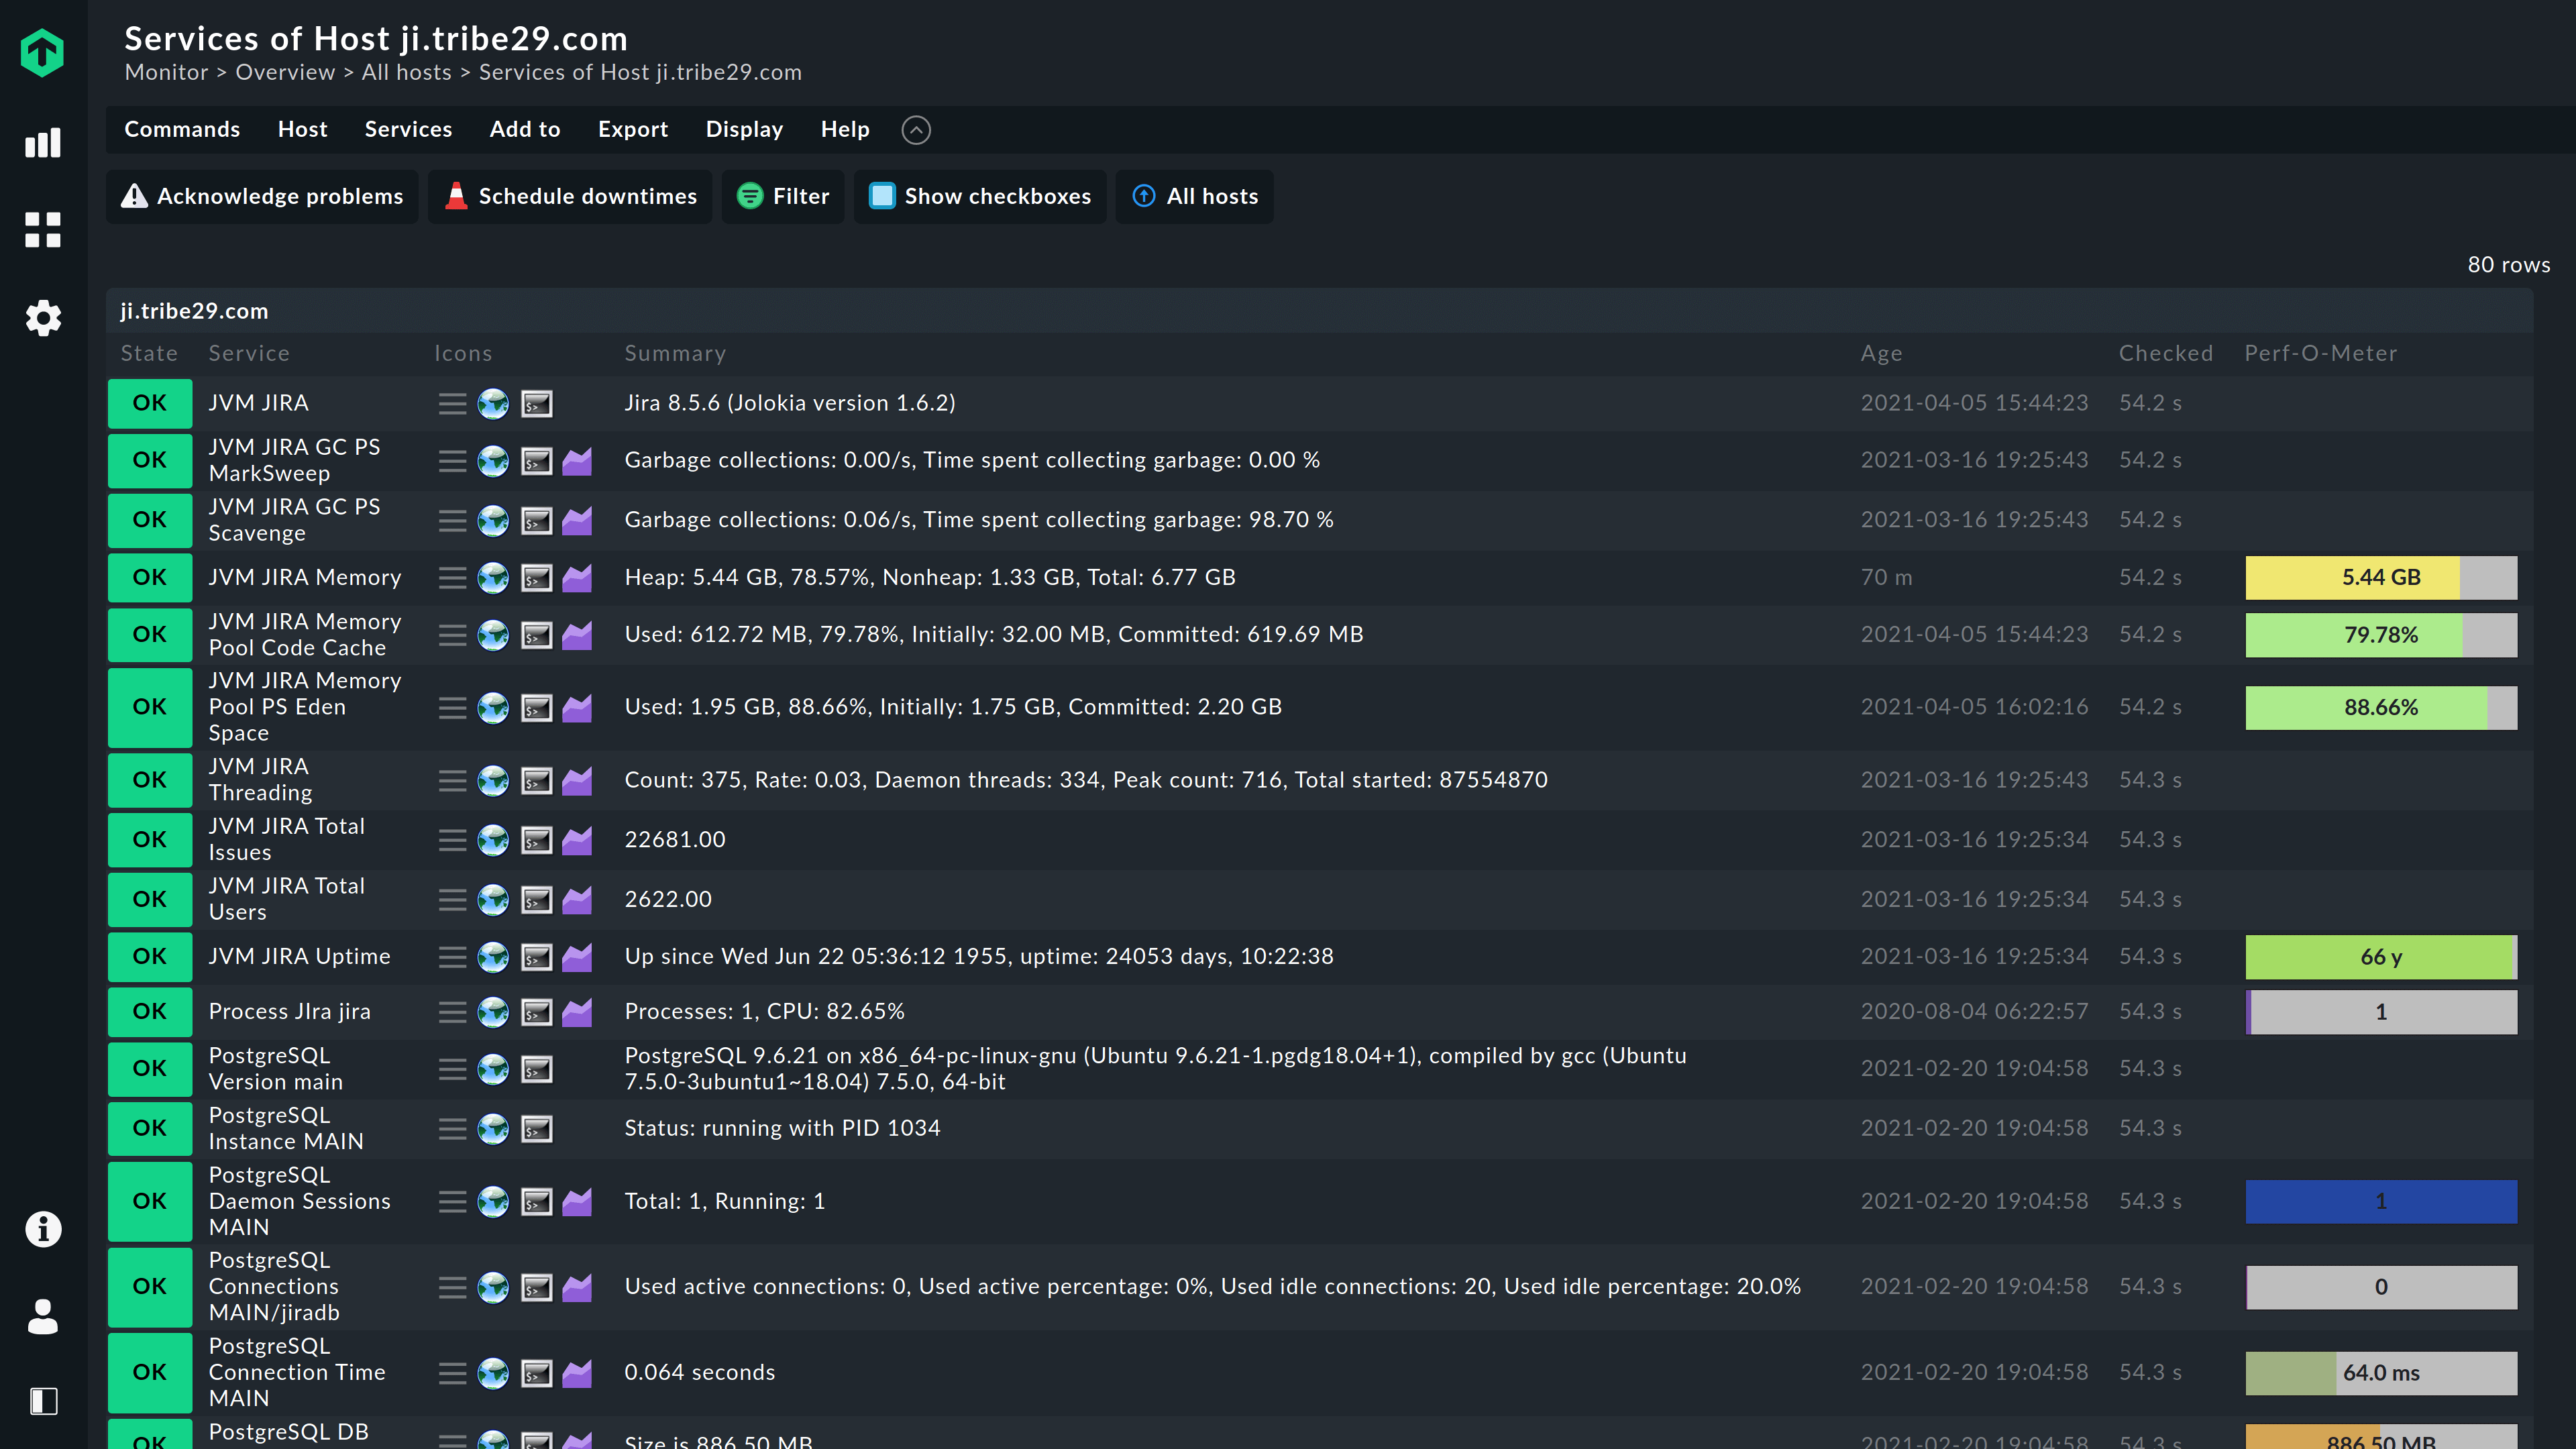 Keep applications and application servers online longer by detecting and fixing potential problems at an early stage. Preventive monitoring is only possible if you monitor your applications comprehensively. Only by monitoring the availability and status of the individual components of an application can high availability be achieved in the first place.
Checkmk’s comprehensive monitoring of the applications and the associated components provides a basis for keeping an eye not only on the overall state, but also on the partial states if required.
No special application knowledge of a monitoring administrator is necessary, since Checkmk almost always provides default threshold values for generating alerts.
As an application monitoring tool Checkmk offers many off-the-shelf integrations for typical applications such as nginx, Microsoft Exchange, salesforce, Veeam or SAP HANA.
Increasing the availability of your applications
Keep applications and application servers online longer by detecting and fixing potential problems at an early stage. Preventive monitoring is only possible if you monitor your applications comprehensively. Only by monitoring the availability and status of the individual components of an application can high availability be achieved in the first place.
Checkmk’s comprehensive monitoring of the applications and the associated components provides a basis for keeping an eye not only on the overall state, but also on the partial states if required.
No special application knowledge of a monitoring administrator is necessary, since Checkmk almost always provides default threshold values for generating alerts.
As an application monitoring tool Checkmk offers many off-the-shelf integrations for typical applications such as nginx, Microsoft Exchange, salesforce, Veeam or SAP HANA.

Preventing scaling issues with application monitoring
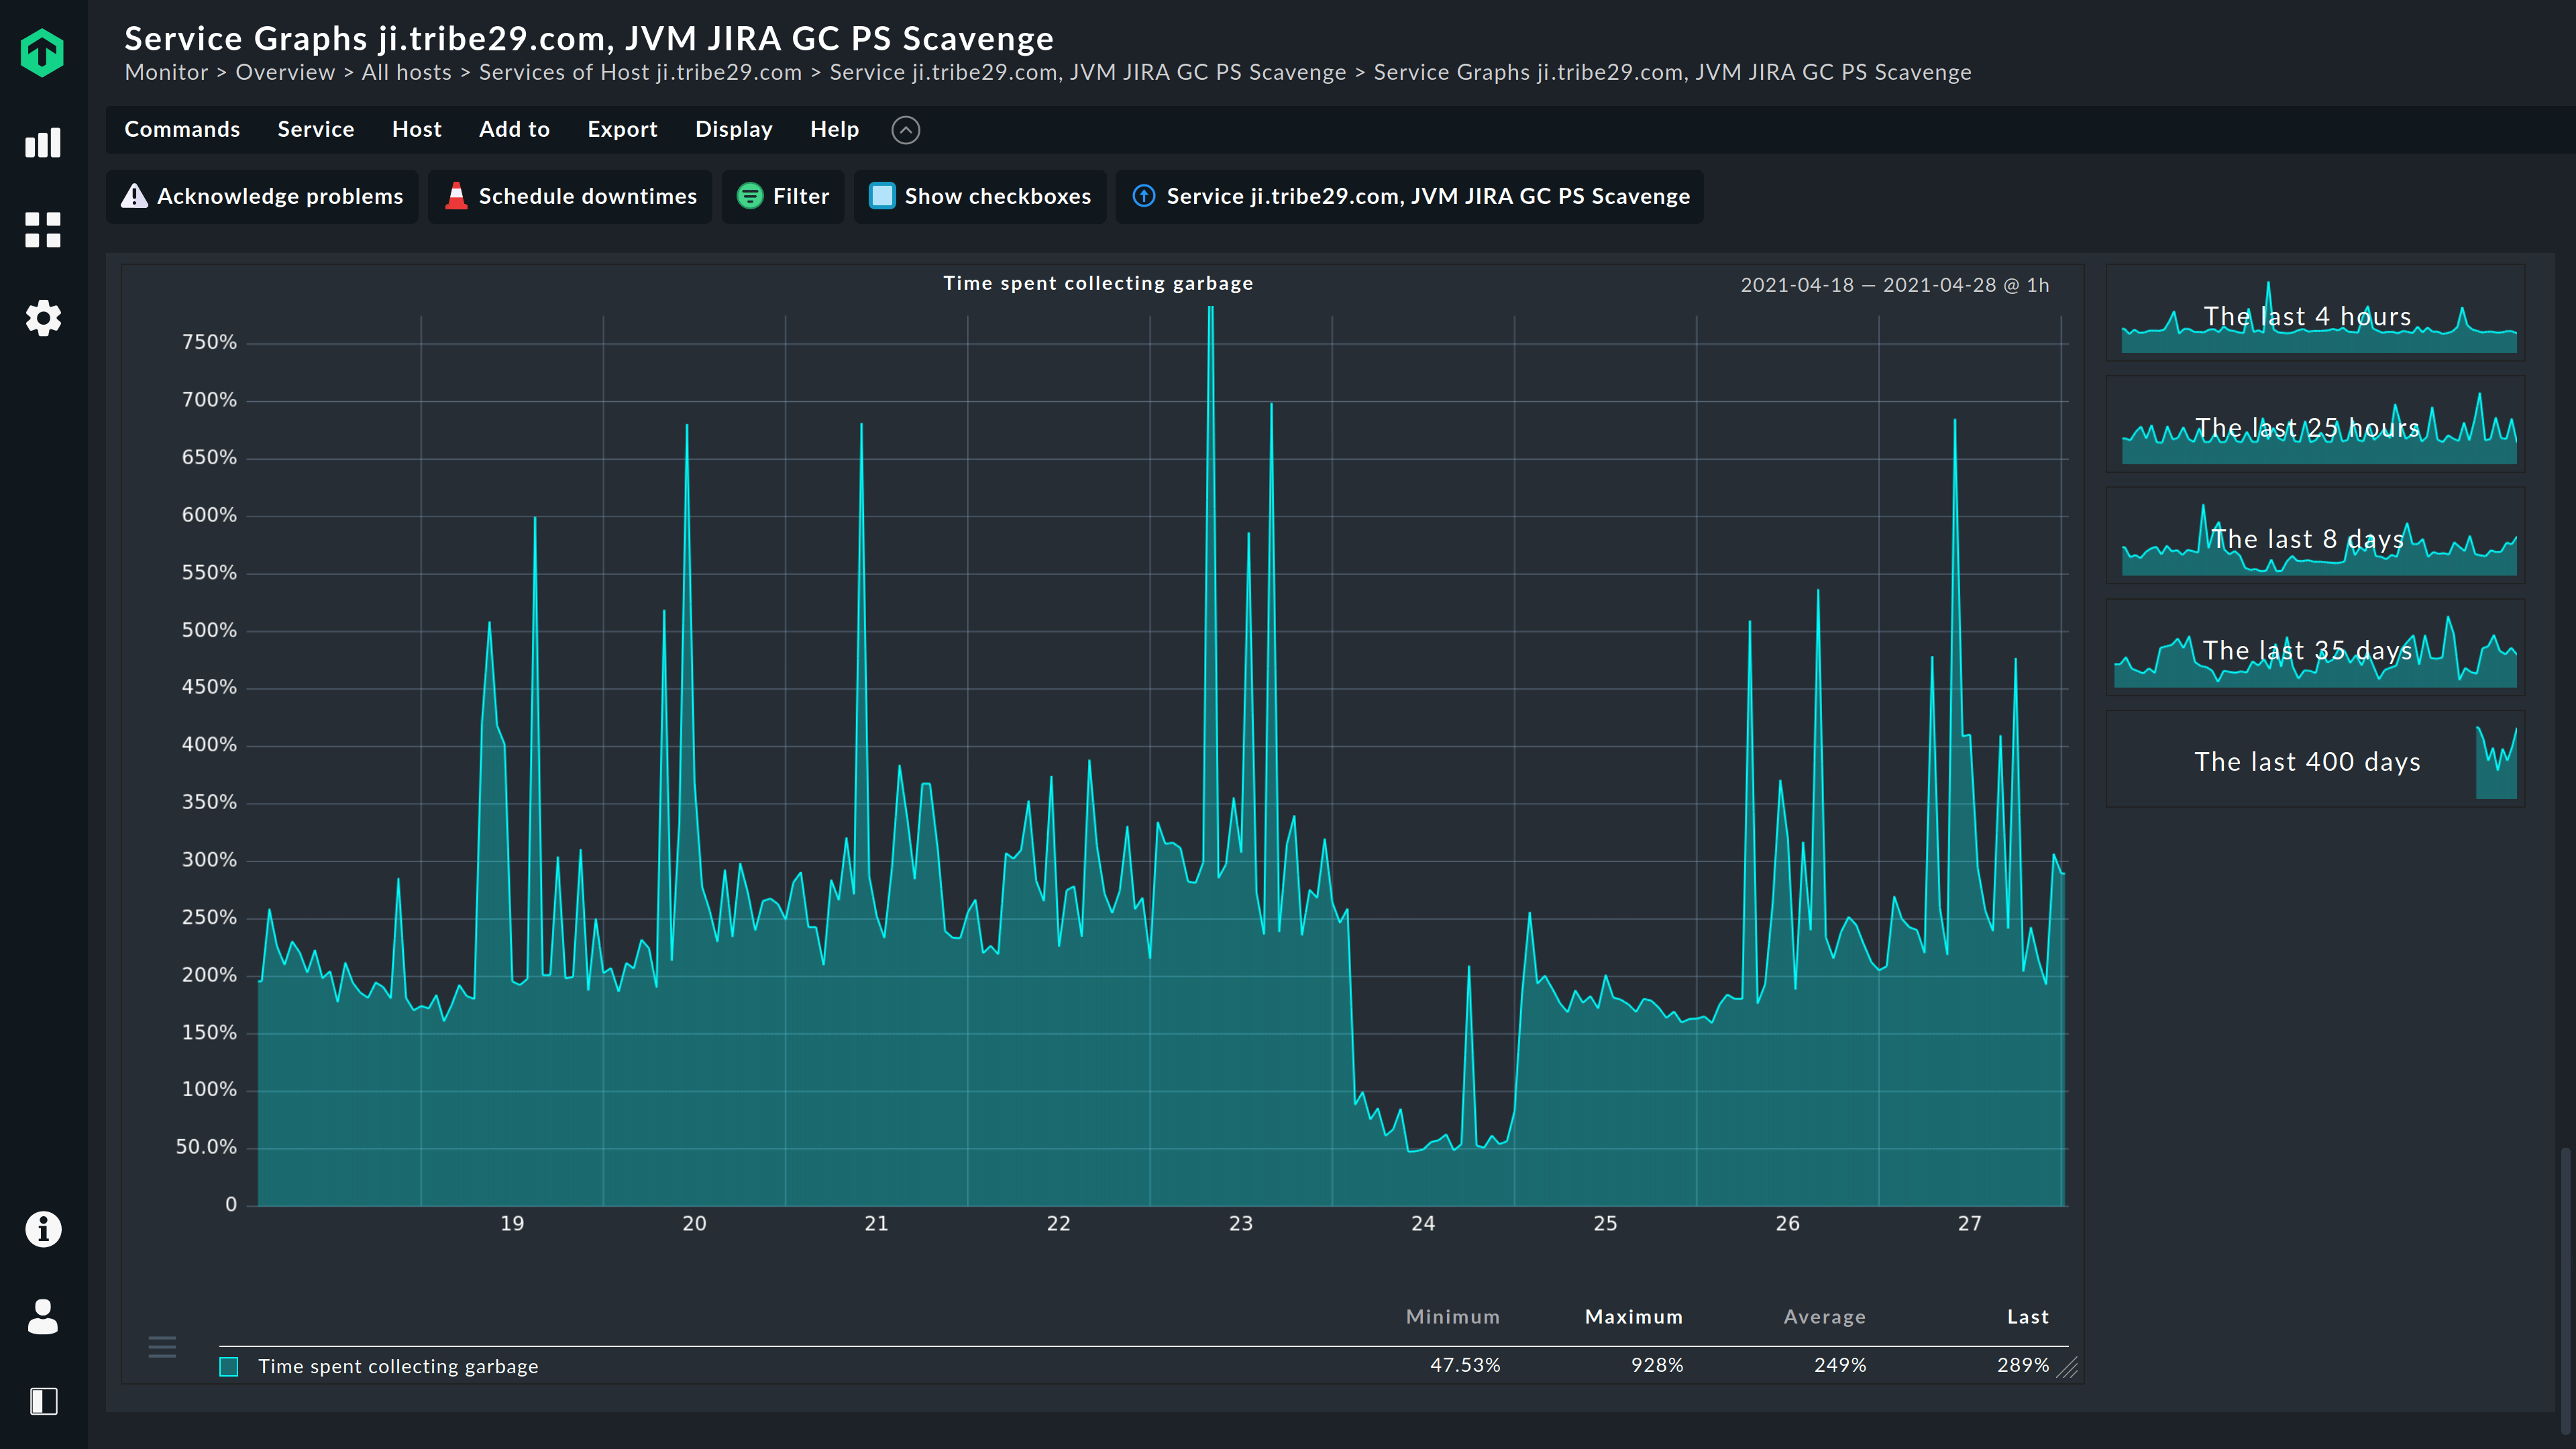 Application monitoring helps you to better estimate the current and future resource requirements of applications. Identify unused resources as well as future bottlenecks in resources at an early stage using the metrics from the applications.
Applications that only require a small number of resources can be isolated. Long-term monitoring of the applications also allows you to understand larger patterns (e.g. only seasonal high utilization of web servers).
Checkmk offers comprehensive methods for retrospectively assessing the scaling needs of application servers, and has methods for efficient long-term data storage.
This also ultimately helps you to reduce the TCO (total cost of ownership) of your IT!
Preventing scaling issues with application monitoring
Application monitoring helps you to better estimate the current and future resource requirements of applications. Identify unused resources as well as future bottlenecks in resources at an early stage using the metrics from the applications.
Applications that only require a small number of resources can be isolated. Long-term monitoring of the applications also allows you to understand larger patterns (e.g. only seasonal high utilization of web servers).
Checkmk offers comprehensive methods for retrospectively assessing the scaling needs of application servers, and has methods for efficient long-term data storage.
This also ultimately helps you to reduce the TCO (total cost of ownership) of your IT!

Application monitoring tool comes with root-cause analysis
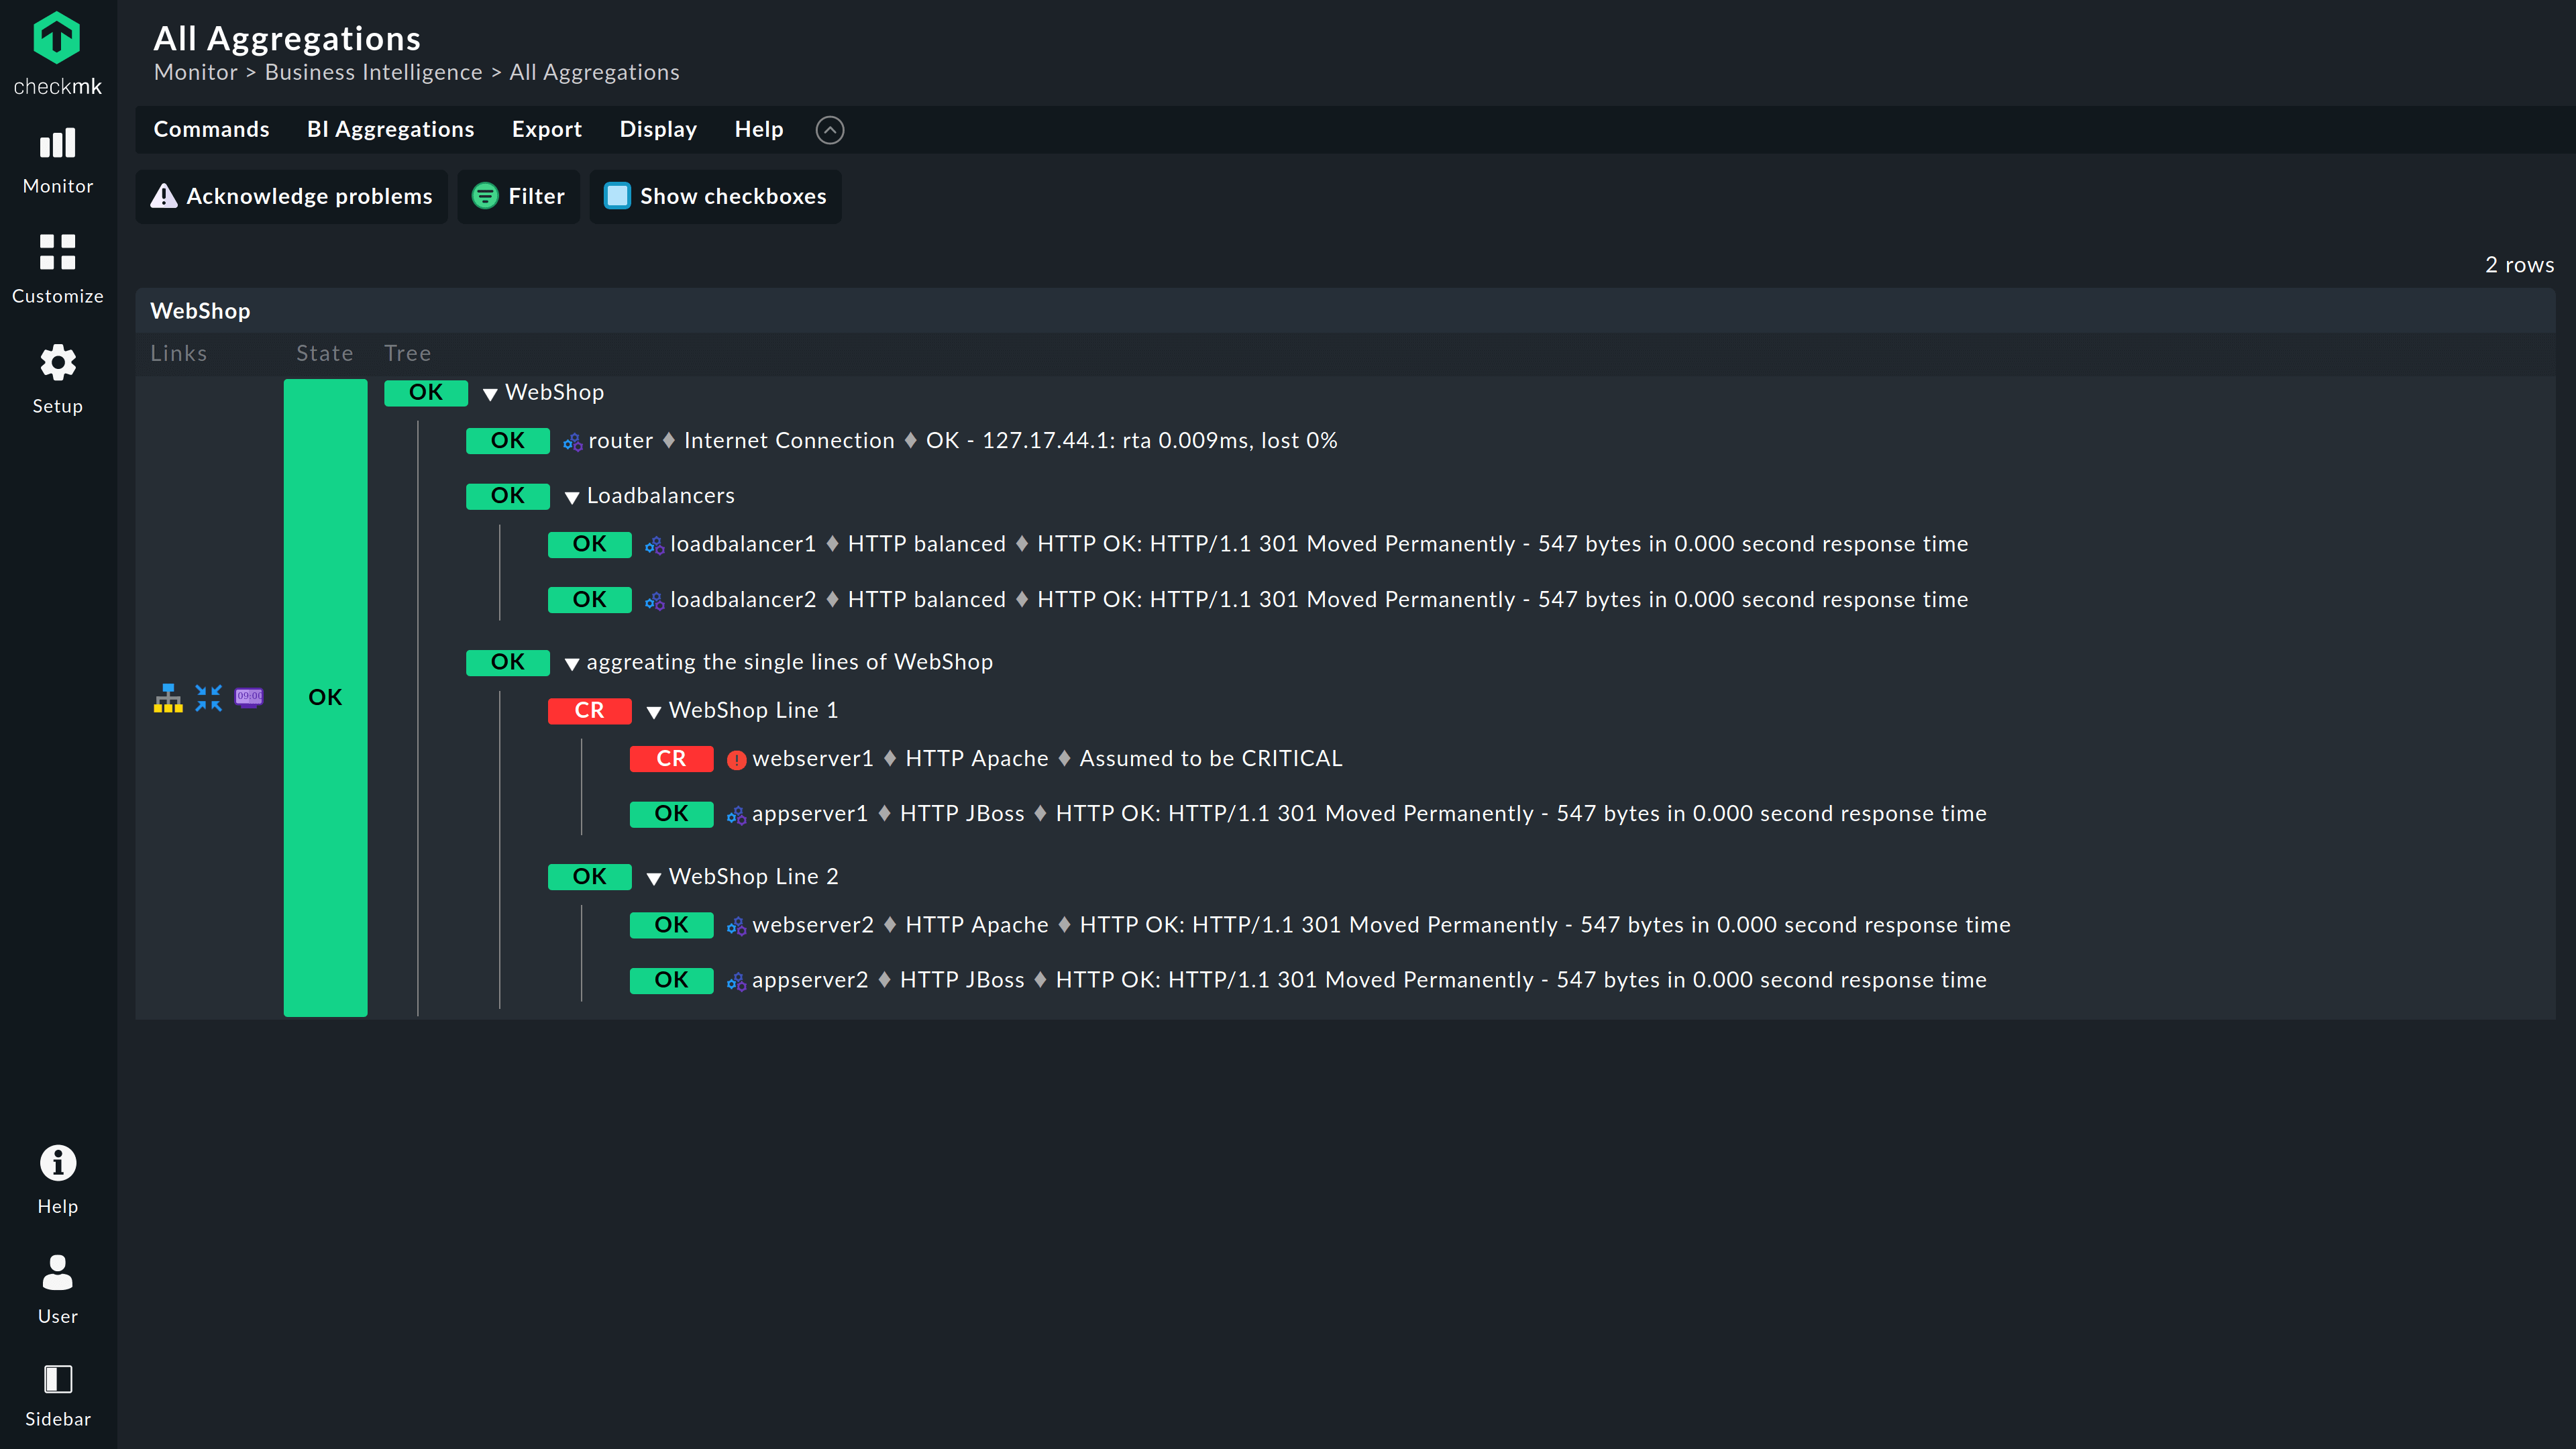 In the end, what matters is that an application’s user can do their job, even if it is only a ‘simple’ thing like sending an email. But finding the cause for your mail system being down can be cumbersome and difficult. In such a stressful situation, you need a application monitoring tool with root-cause analysis capabilities, which can show you immediately where the problem has originated.
Checkmk allows you to model dependencies and create logical application groups, and visualize them with its Business Intelligence feature to perform such a root-cause analysis. You can also simulate what happens when a component of the application fails.
In this way potential performance or availability problems can be identified before they occur.
Application monitoring tool comes with root-cause analysis
In the end, what matters is that an application’s user can do their job, even if it is only a ‘simple’ thing like sending an email. But finding the cause for your mail system being down can be cumbersome and difficult. In such a stressful situation, you need a application monitoring tool with root-cause analysis capabilities, which can show you immediately where the problem has originated.
Checkmk allows you to model dependencies and create logical application groups, and visualize them with its Business Intelligence feature to perform such a root-cause analysis. You can also simulate what happens when a component of the application fails.
In this way potential performance or availability problems can be identified before they occur.

Supported applications and more
Databases
Monitor databases directly on the servers where they run — or from the outside. Use preconfigured thresholds for minimal setup time.
Database Monitoring with Checkmk
Complete monitoring of your database servers and databases – including availability, database and table size, cache ratios and many other metrics.
Some of the vendors Checkmk support

Database Monitoring helps to ensure high performance
Checkmk enables you to see what’s currently running on each of your database instances. Monitor database attributes that are critical to your business operations and visualize them on a custom dashboard:
Oracle Database Monitoring
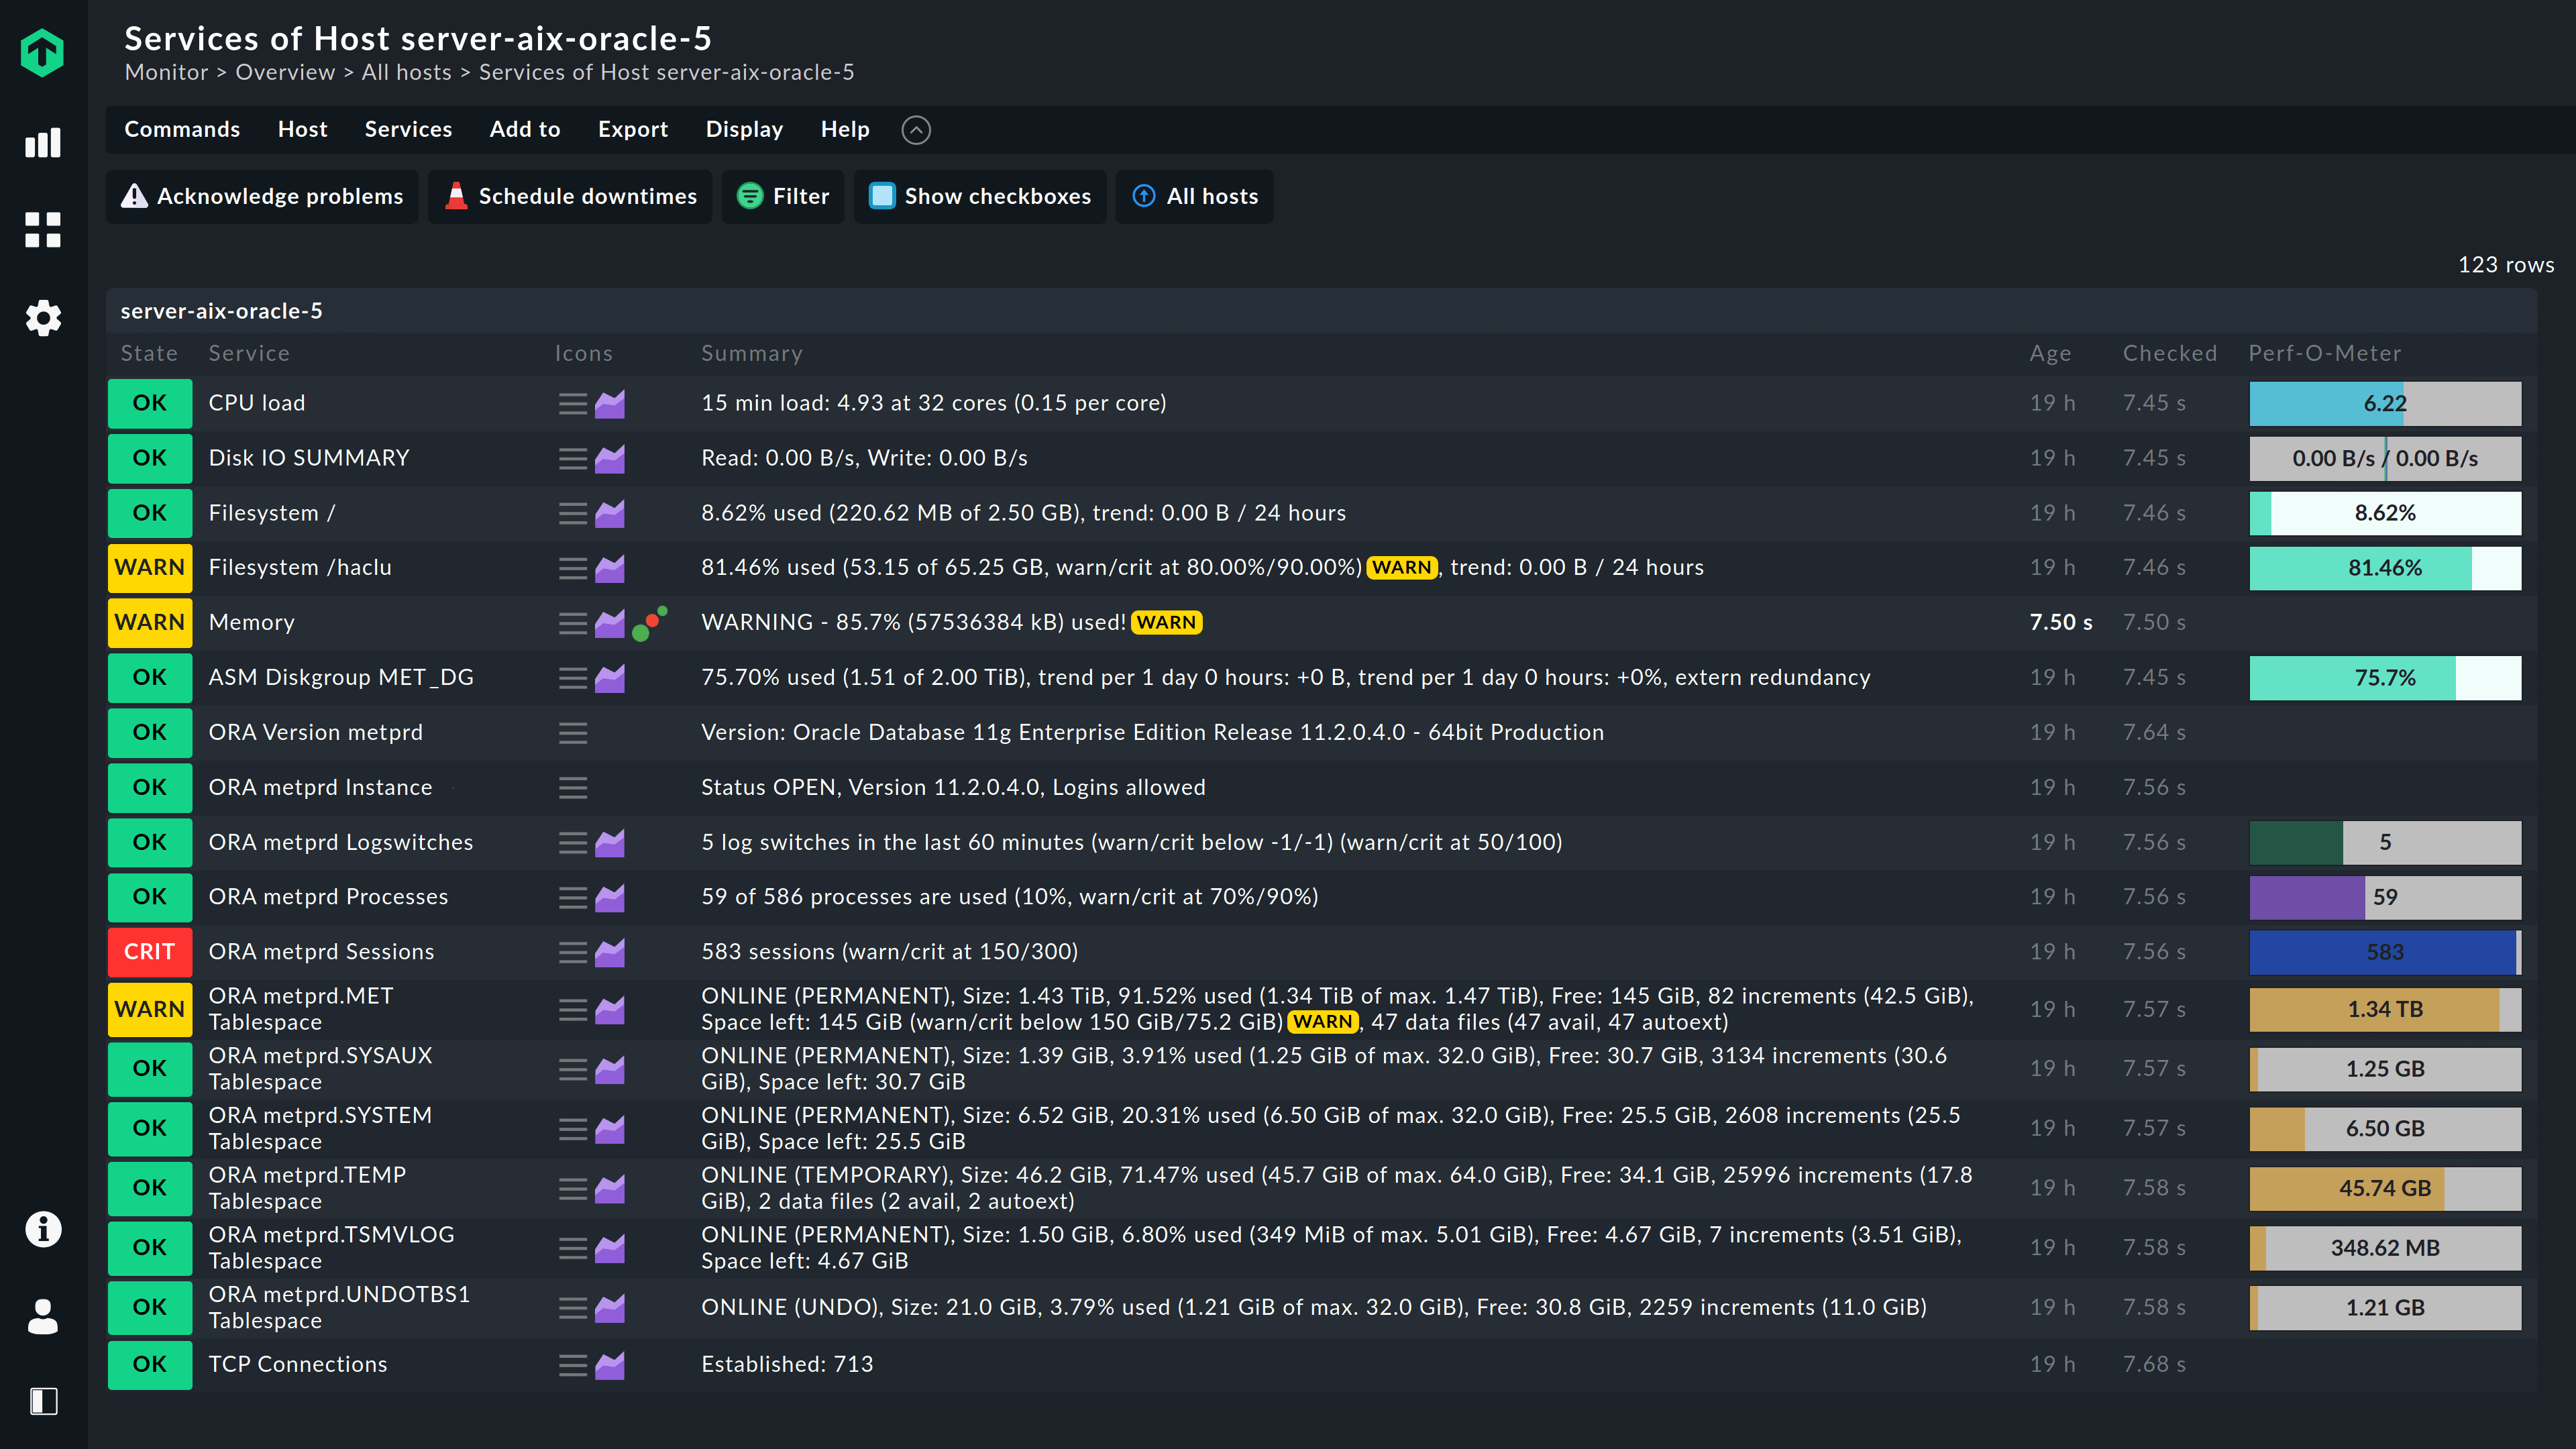
Use just one plug-in to keep an eye on your oracle databases and go beyond monitoring the basics (tablespaces, active sessions etc.), to get in-depth performance data for all your instances.
Checkmk provides comprehensive options for Oracle databases which cover:
- Oracle Real Application Cluster (RAC) with and without Data Guard
- Oracle Automatic Storage Management (ASM)
- Oracle Wallet (allow user access without password)
- Oracle DIVA
- Oracle CRS

MySQL/MariaDB Performance Monitoring
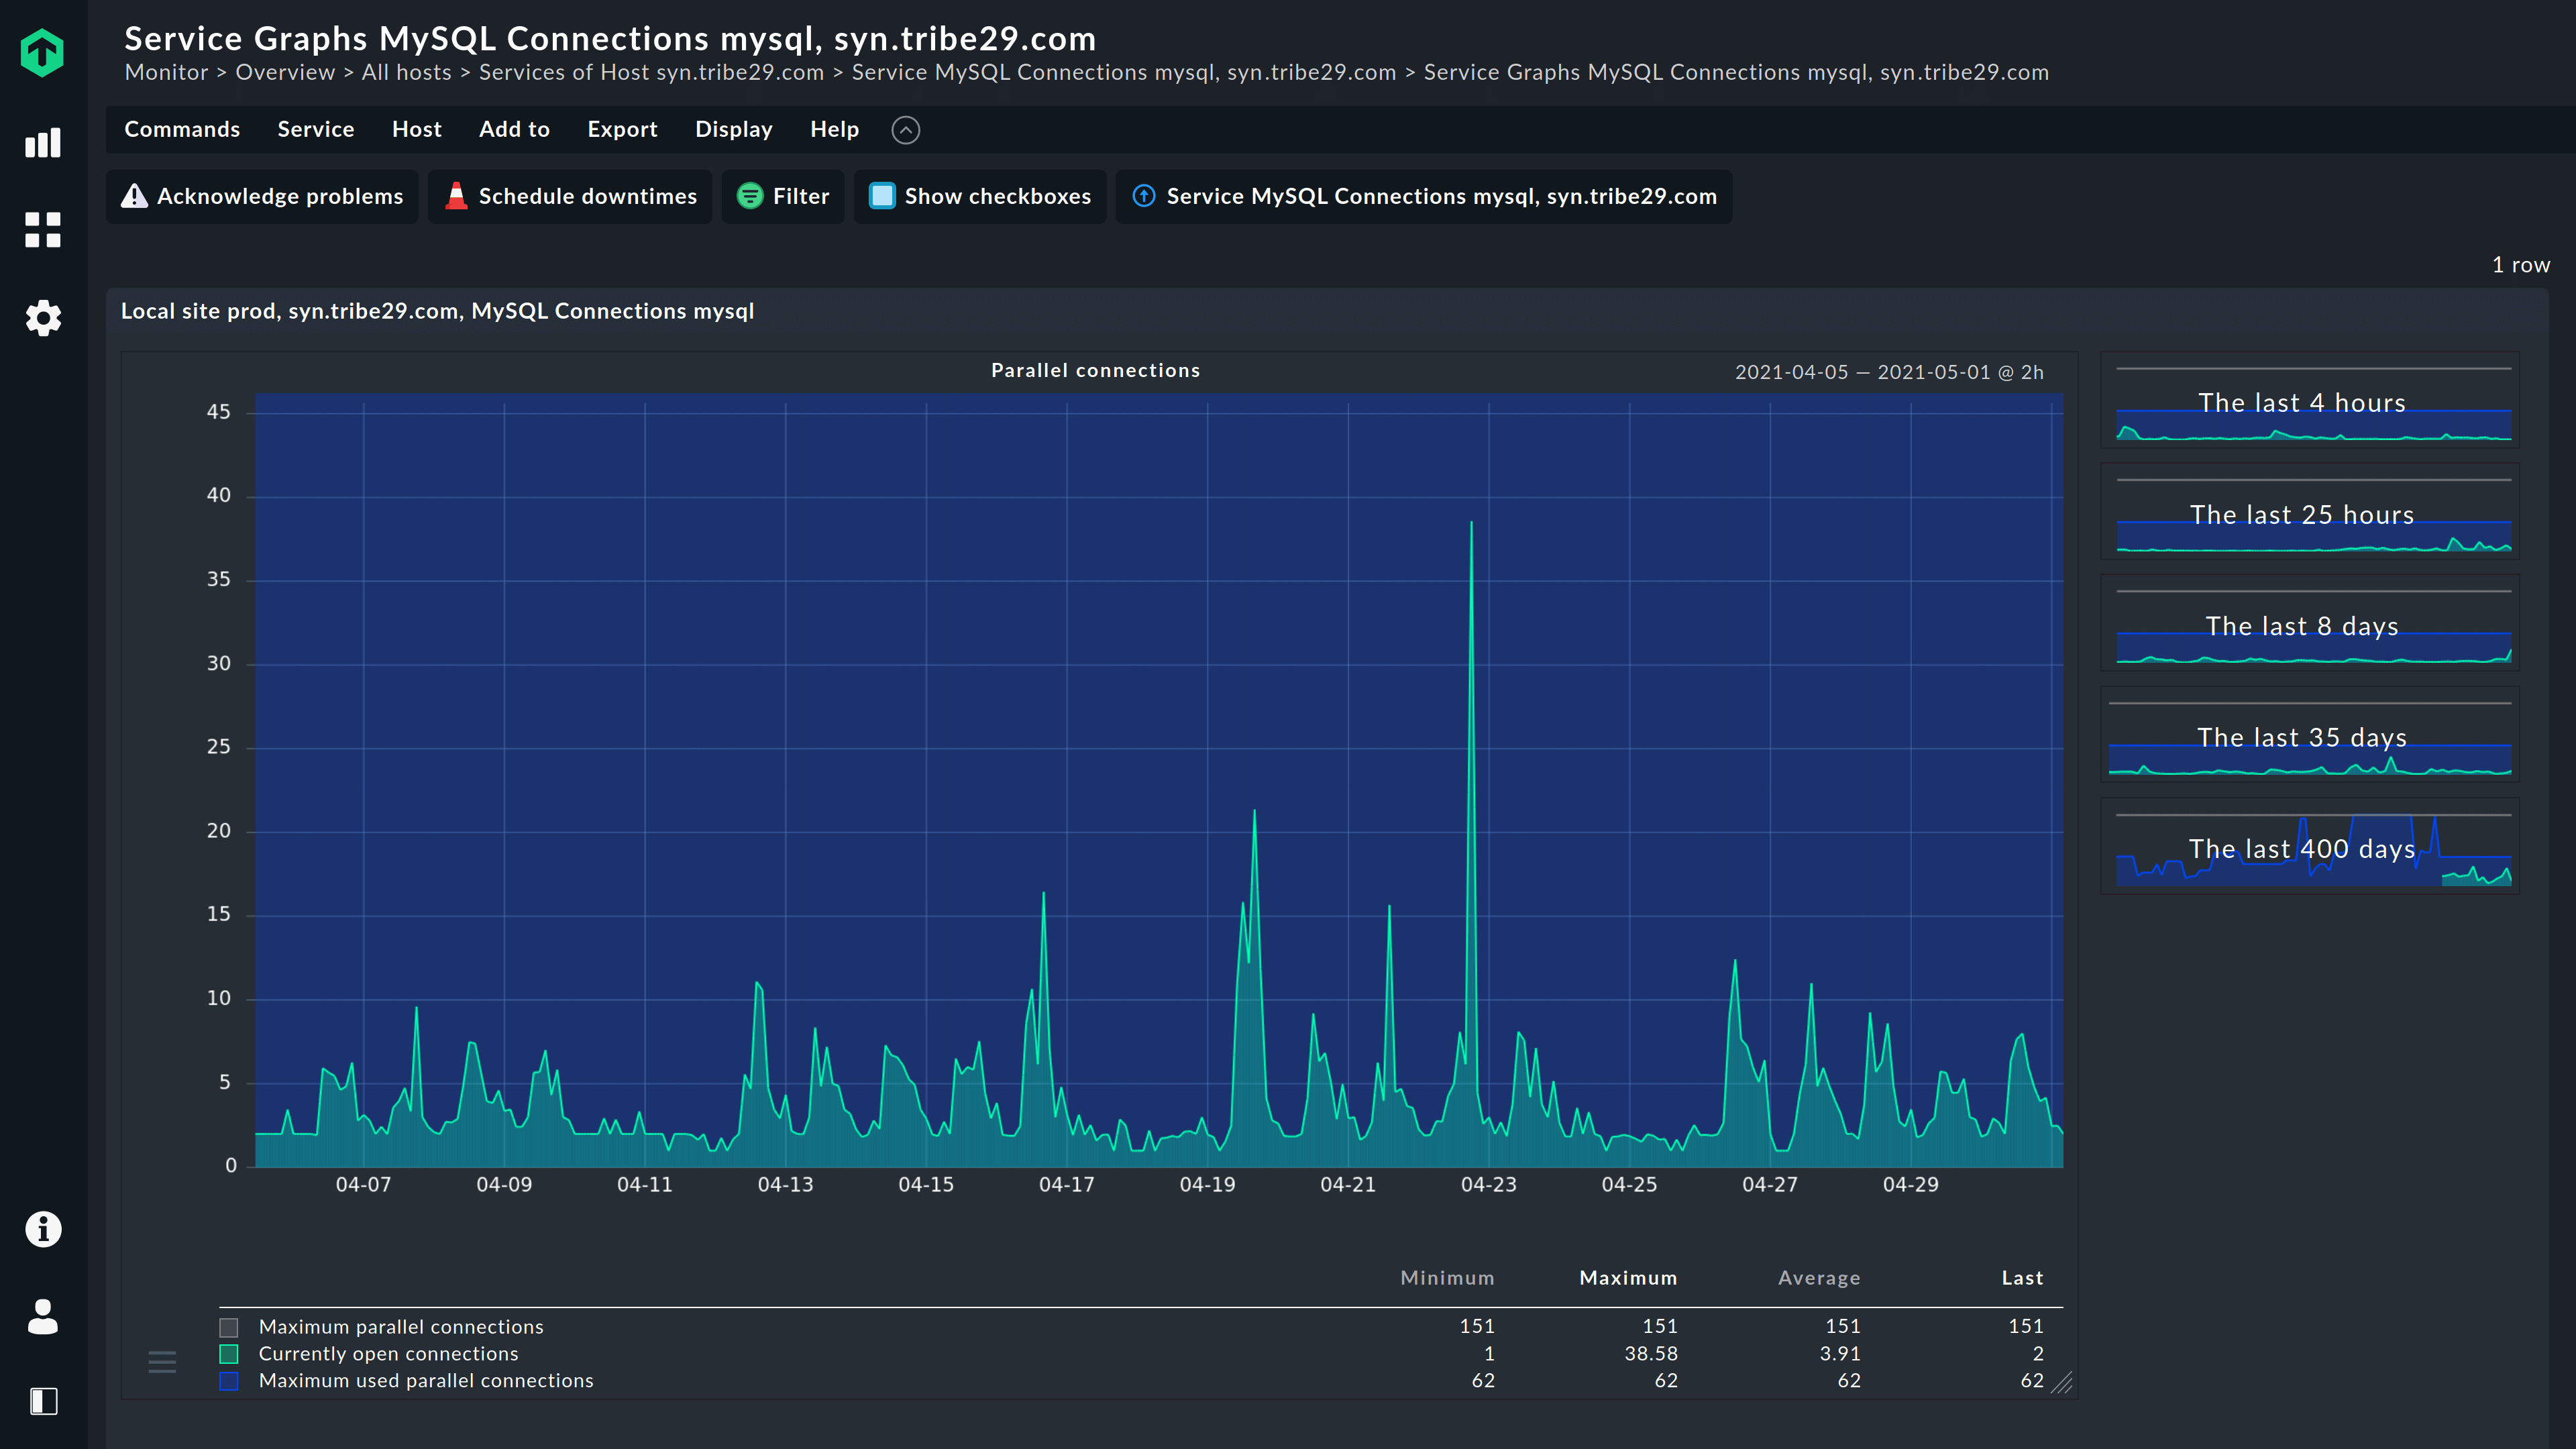
Checkmk is a comprehensive and simple-to-configure tool used to monitor any version of MySQL/MariaDB databases running on Linux and Windows.
Among other possibilities, with Checkmk you can:
- Monitor MySQL/MariaDB clusters, slaves and resource usage
- Track the IO rate of the InnoDB database engine for MySQL

MSSQL Server Monitoring
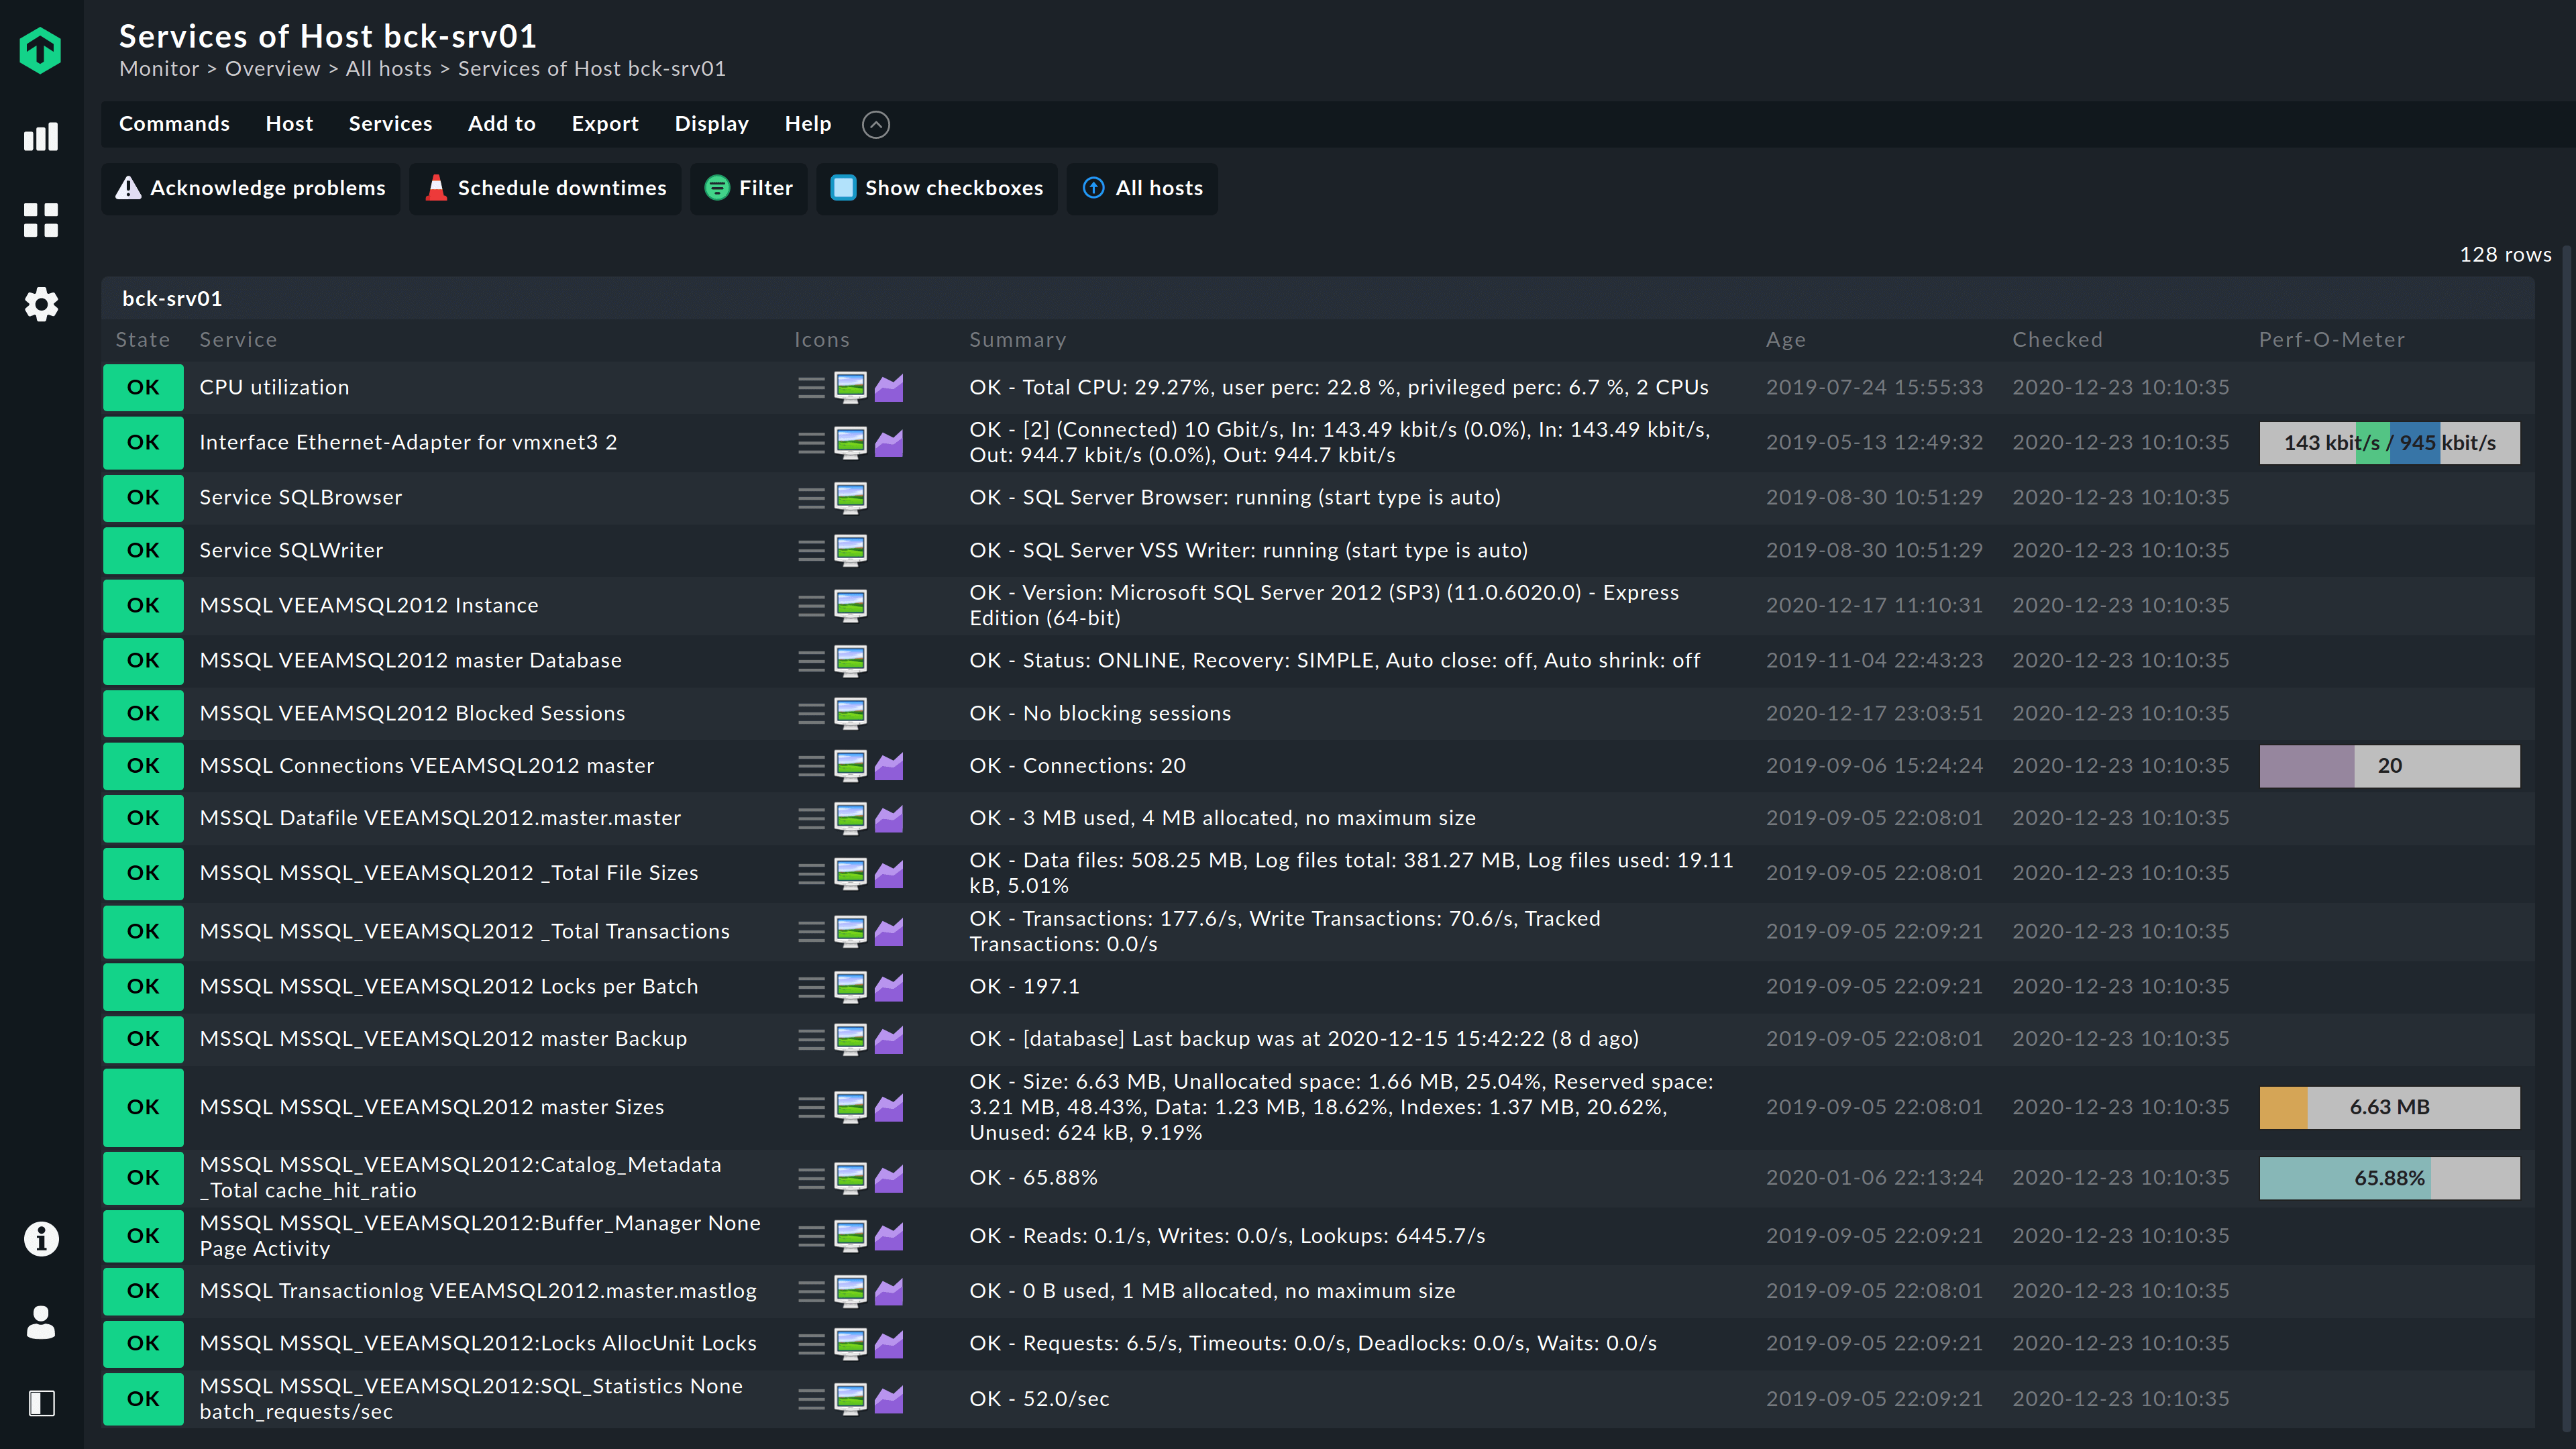
Take a pro-active approach and optimize Microsoft SQL Server performance with ease. Streamline access by using ‘trusted authentication’, so no user/password needs to be created on the SQL Server instance.
Use separate services of backup type for each tablespace, and set specific levels for each backup type. Understand how application performance is affected by getting detailed info on metrics such as:
- Locks per batch and locks per second
- Cache hit ratio
- Transactions per second
- Size of data and log files

Cloud
Track workloads, bottlenecks, availability and performance across your public, private or hybrid cloud infrastructure.
Cloud Monitoring for Public, Private or Hybrid Clouds
A powerful IT monitoring solution to help you track workloads, bottlenecks, availability and performance for your cloud applications and infrastructure.
A cloud monitoring tool built for enterprise cloud ecosystems
Checkmk provides in-depth insights into the health and performance of your cloud infrastructure and allows IT adminstrators to create custom dashboards to monitor all nodes, servers and hosts.
Analyze various system and infrastructure parameters to ensure optimal performance for your applications and cloud resources.
- Get full visibility across all cloud and on-premise tiers, including OS-level and other important network metrics
- Manage system health and easily trace errors across complex, distributed architectures.
- Eliminate all blind spots by detecting issues related to 3rd party services, load-balancers, disconnected hosts, or limited network visibility.
Intelligent AWS monitoring
Simplify cloud complexity by using an all-in-one platform to move beyond application performance monitoring.
Checkmk is built for monitoring your public, private and/or hybrid enterprise cloud ecosystems and helps with:
- Unified insights into the availability and performance of workloads running on AWS
- Custom dashboards that provide an overview of your entire cloud ecosystem
- Granular detection of issues and in-depth root-cause analysis
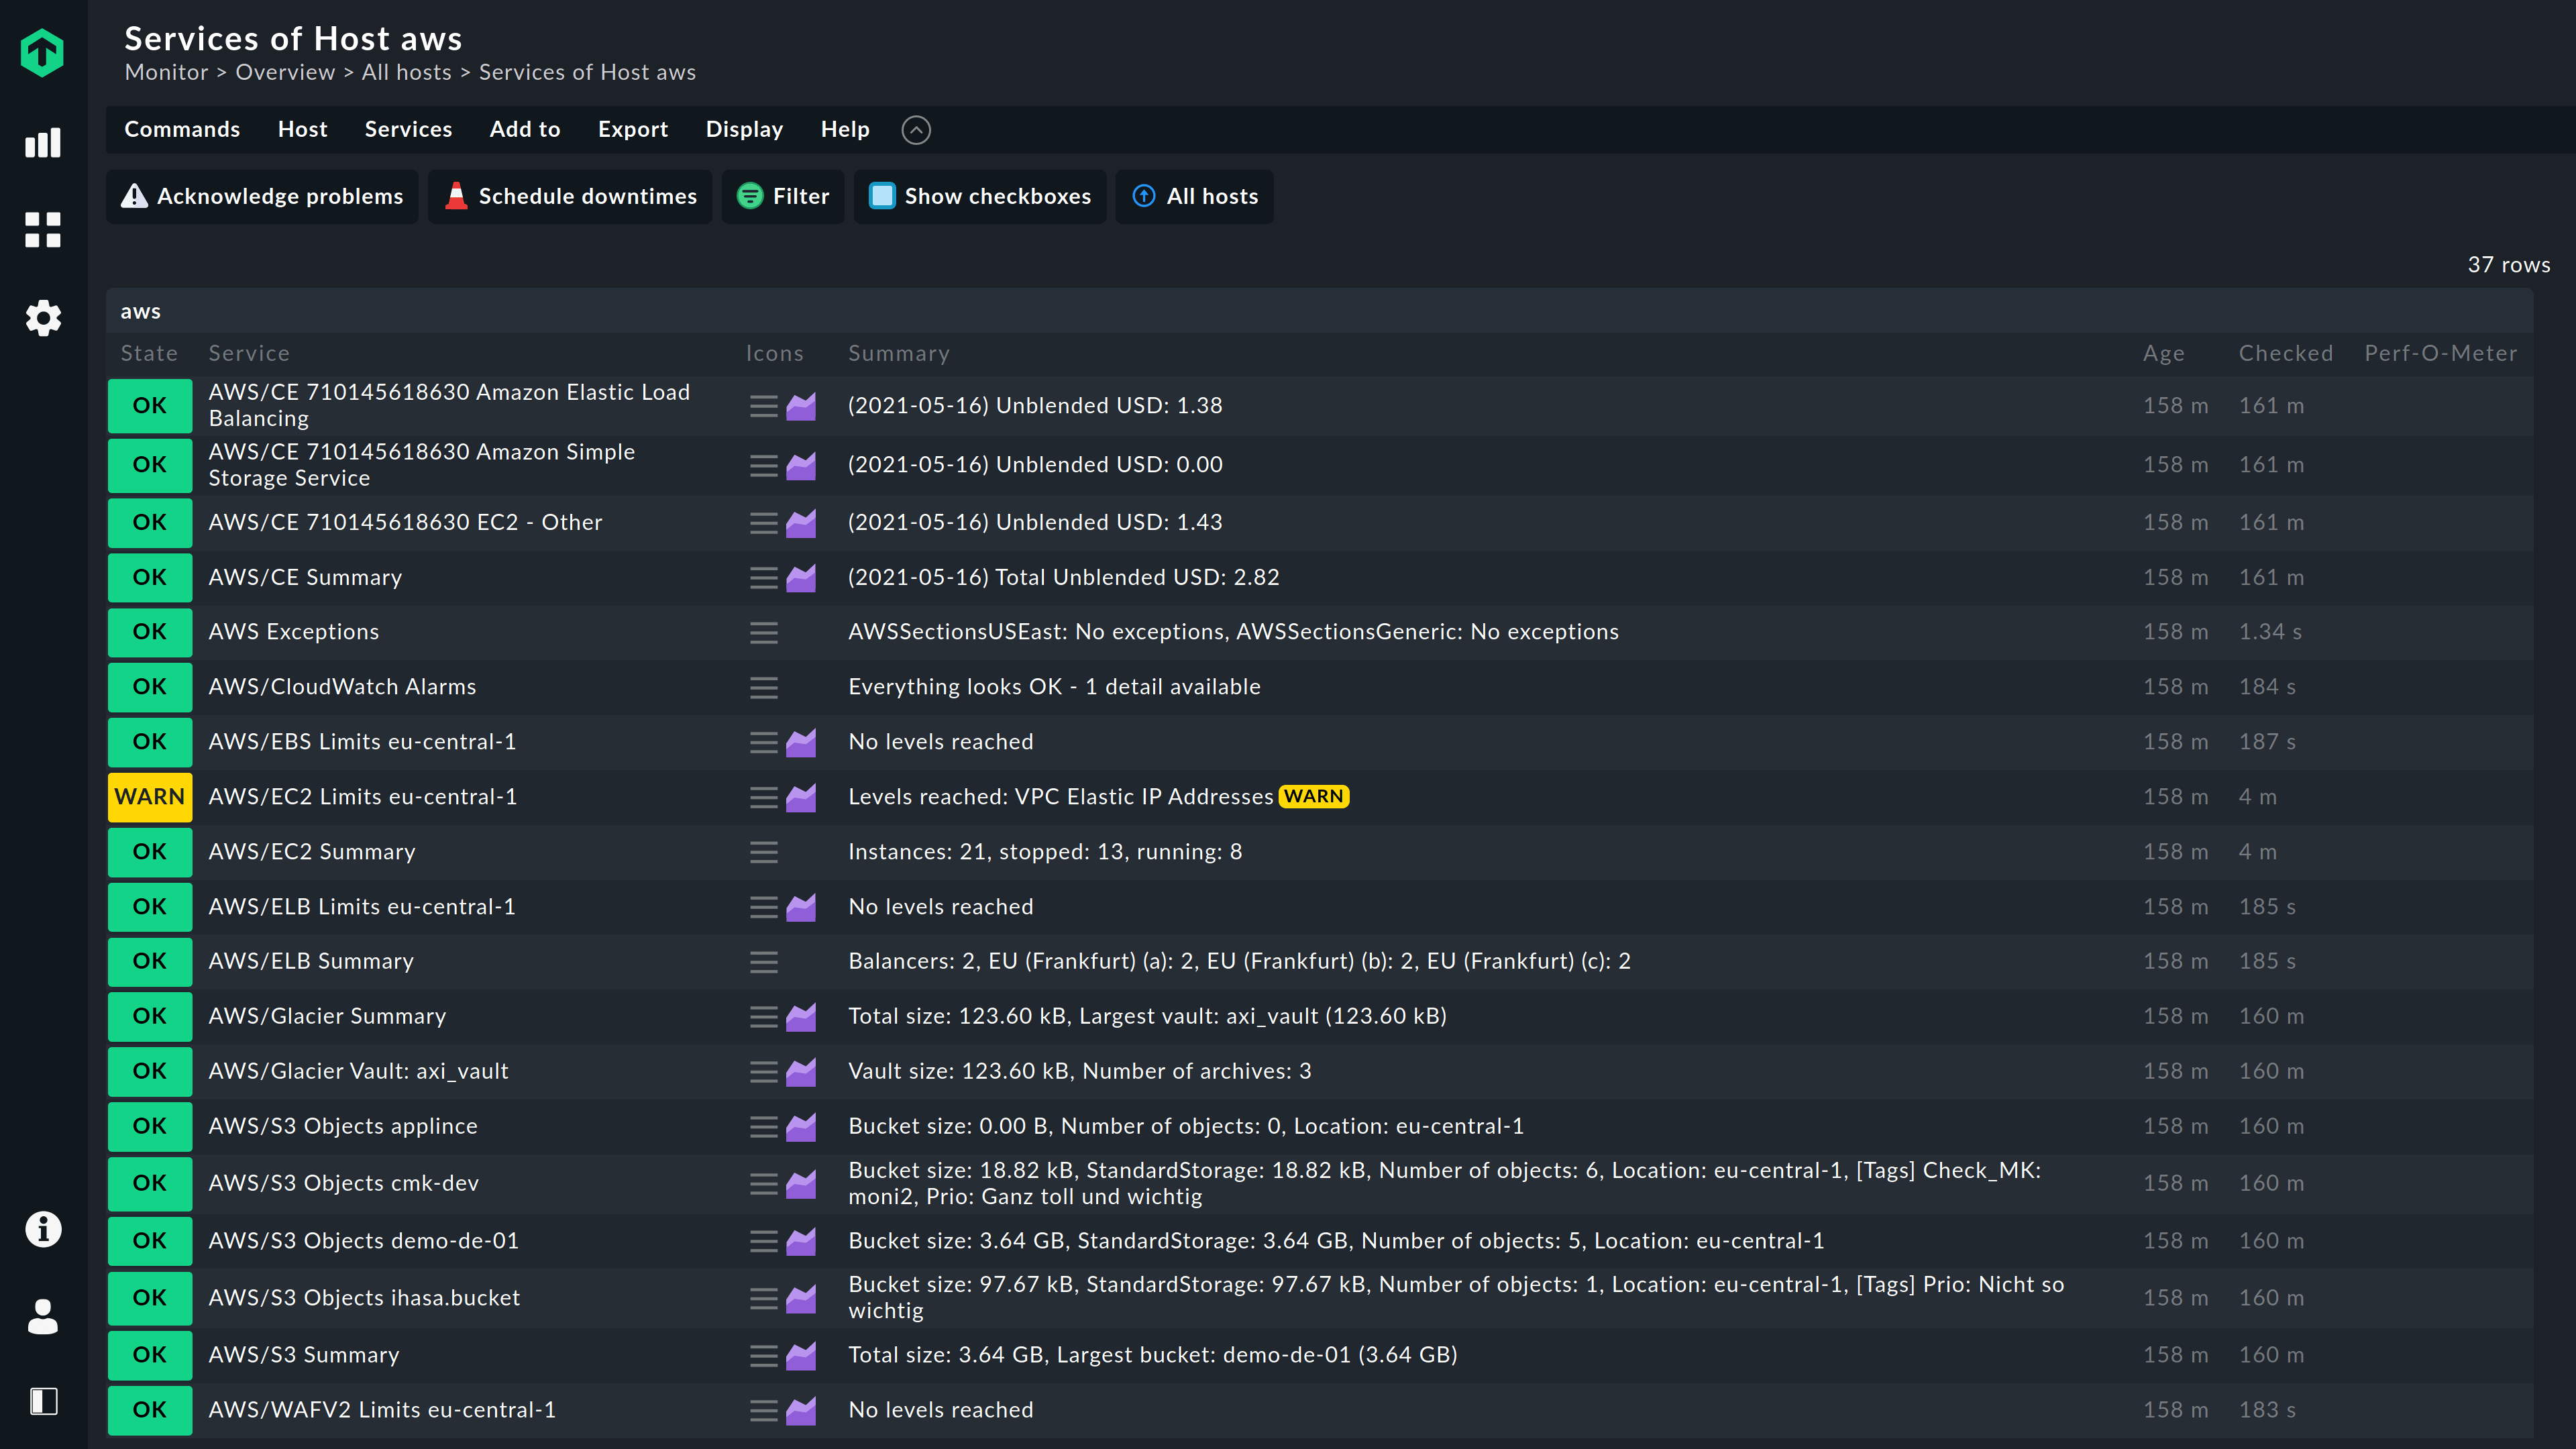

AWS services currently supported by Checkmk:

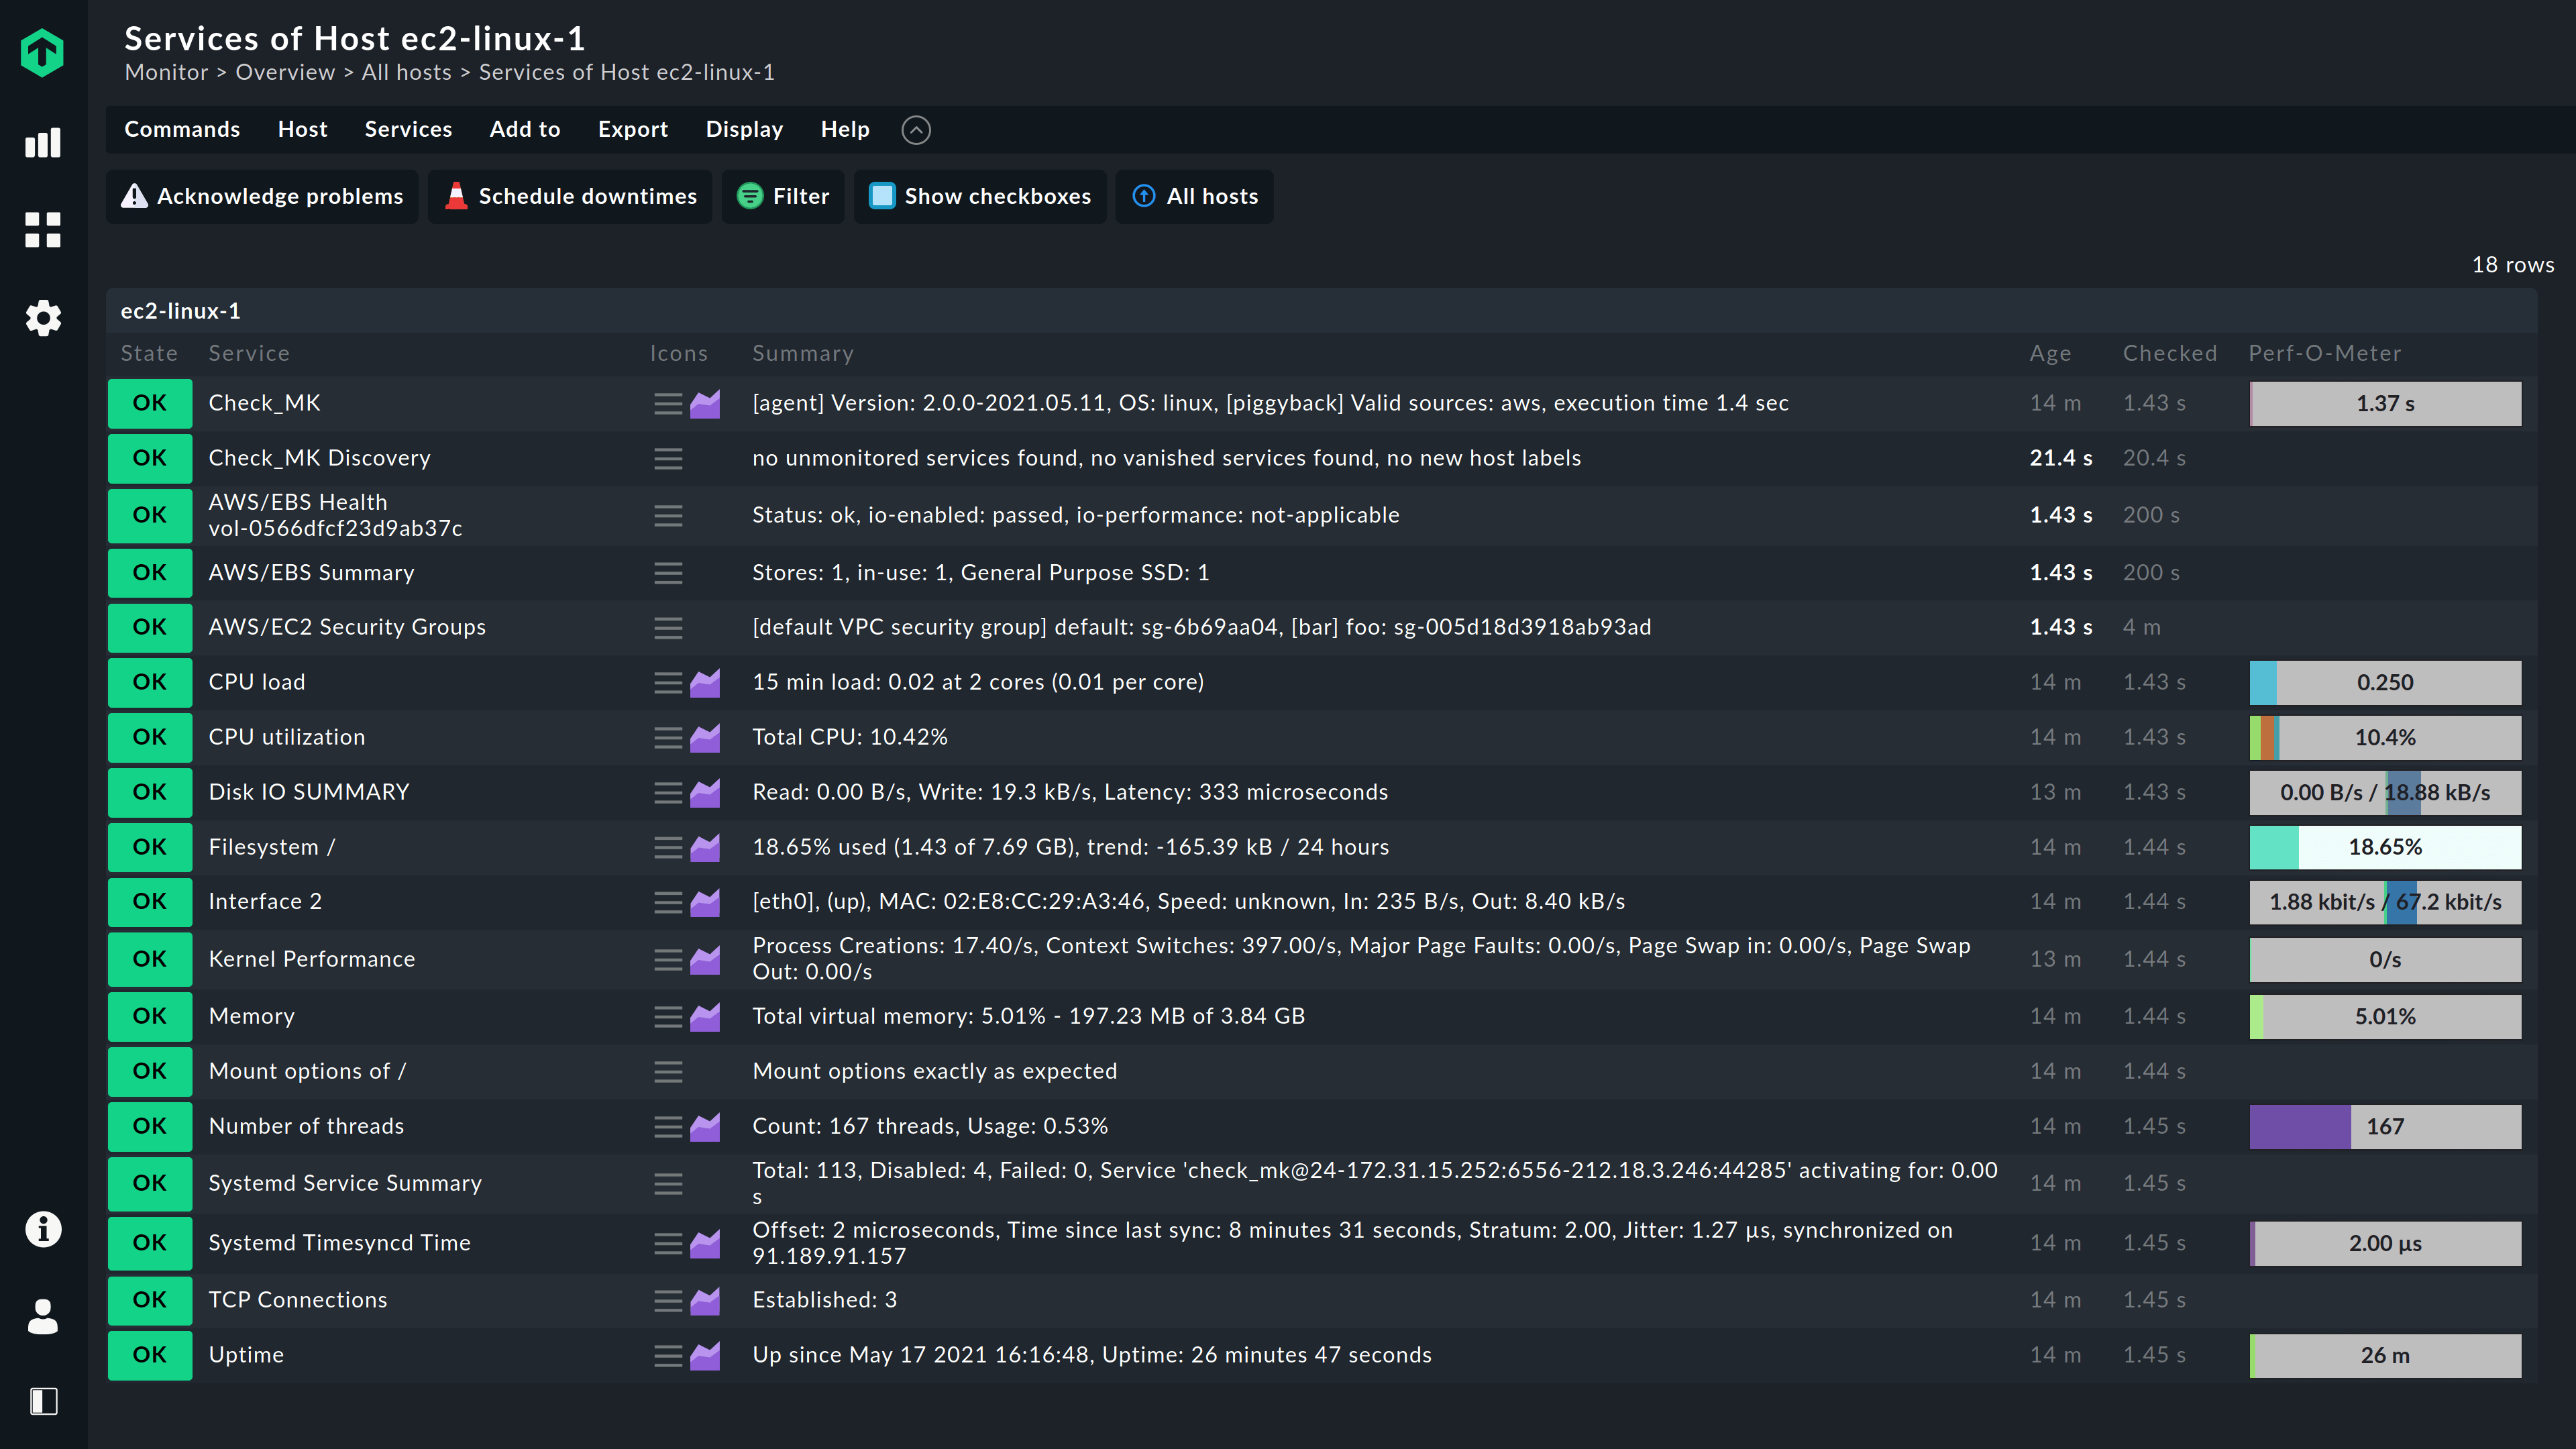
Azure services currently supported by Checkmk:

Full-stack Azure cloud monitoring
Monitor high-volume Azure SaaS, IaaS and PaaS production environments. Get detailed insights and metrics on the performance of your systems, applications and cloud resources.
Use Checkmk to:
- Visualize and correlate performance metrics across your entire environment
- Identify the databases and web services which perform suboptimally
- Create alerts and notifications with custom filters that can be applied to Azure workloads
AWS services currently supported by Checkmk:

Full-stack Azure cloud monitoring
Monitor high-volume Azure SaaS, IaaS and PaaS production environments. Get detailed insights and metrics on the performance of your systems, applications and cloud resources.
Use Checkmk to:
- Visualize and correlate performance metrics across your entire environment
- Identify the databases and web services which perform suboptimally
- Create alerts and notifications with custom filters that can be applied to Azure workloads

Azure services currently supported by Checkmk:

Automated, dynamic cloud monitoring
Monitoring your cloud environments is now radically simplified since Checkmk 1.6.
The already existing auto-discovery for services will be complemented by the Dynamic Configuration Daemon for hosts. This means no more manual adding and removing of hosts (e.g. your EC2 instances) into your monitoring — this will be done automatically by Checkmk.
You will thus benefit from an automatic detection, configuration and mapping of your hosts, services and node
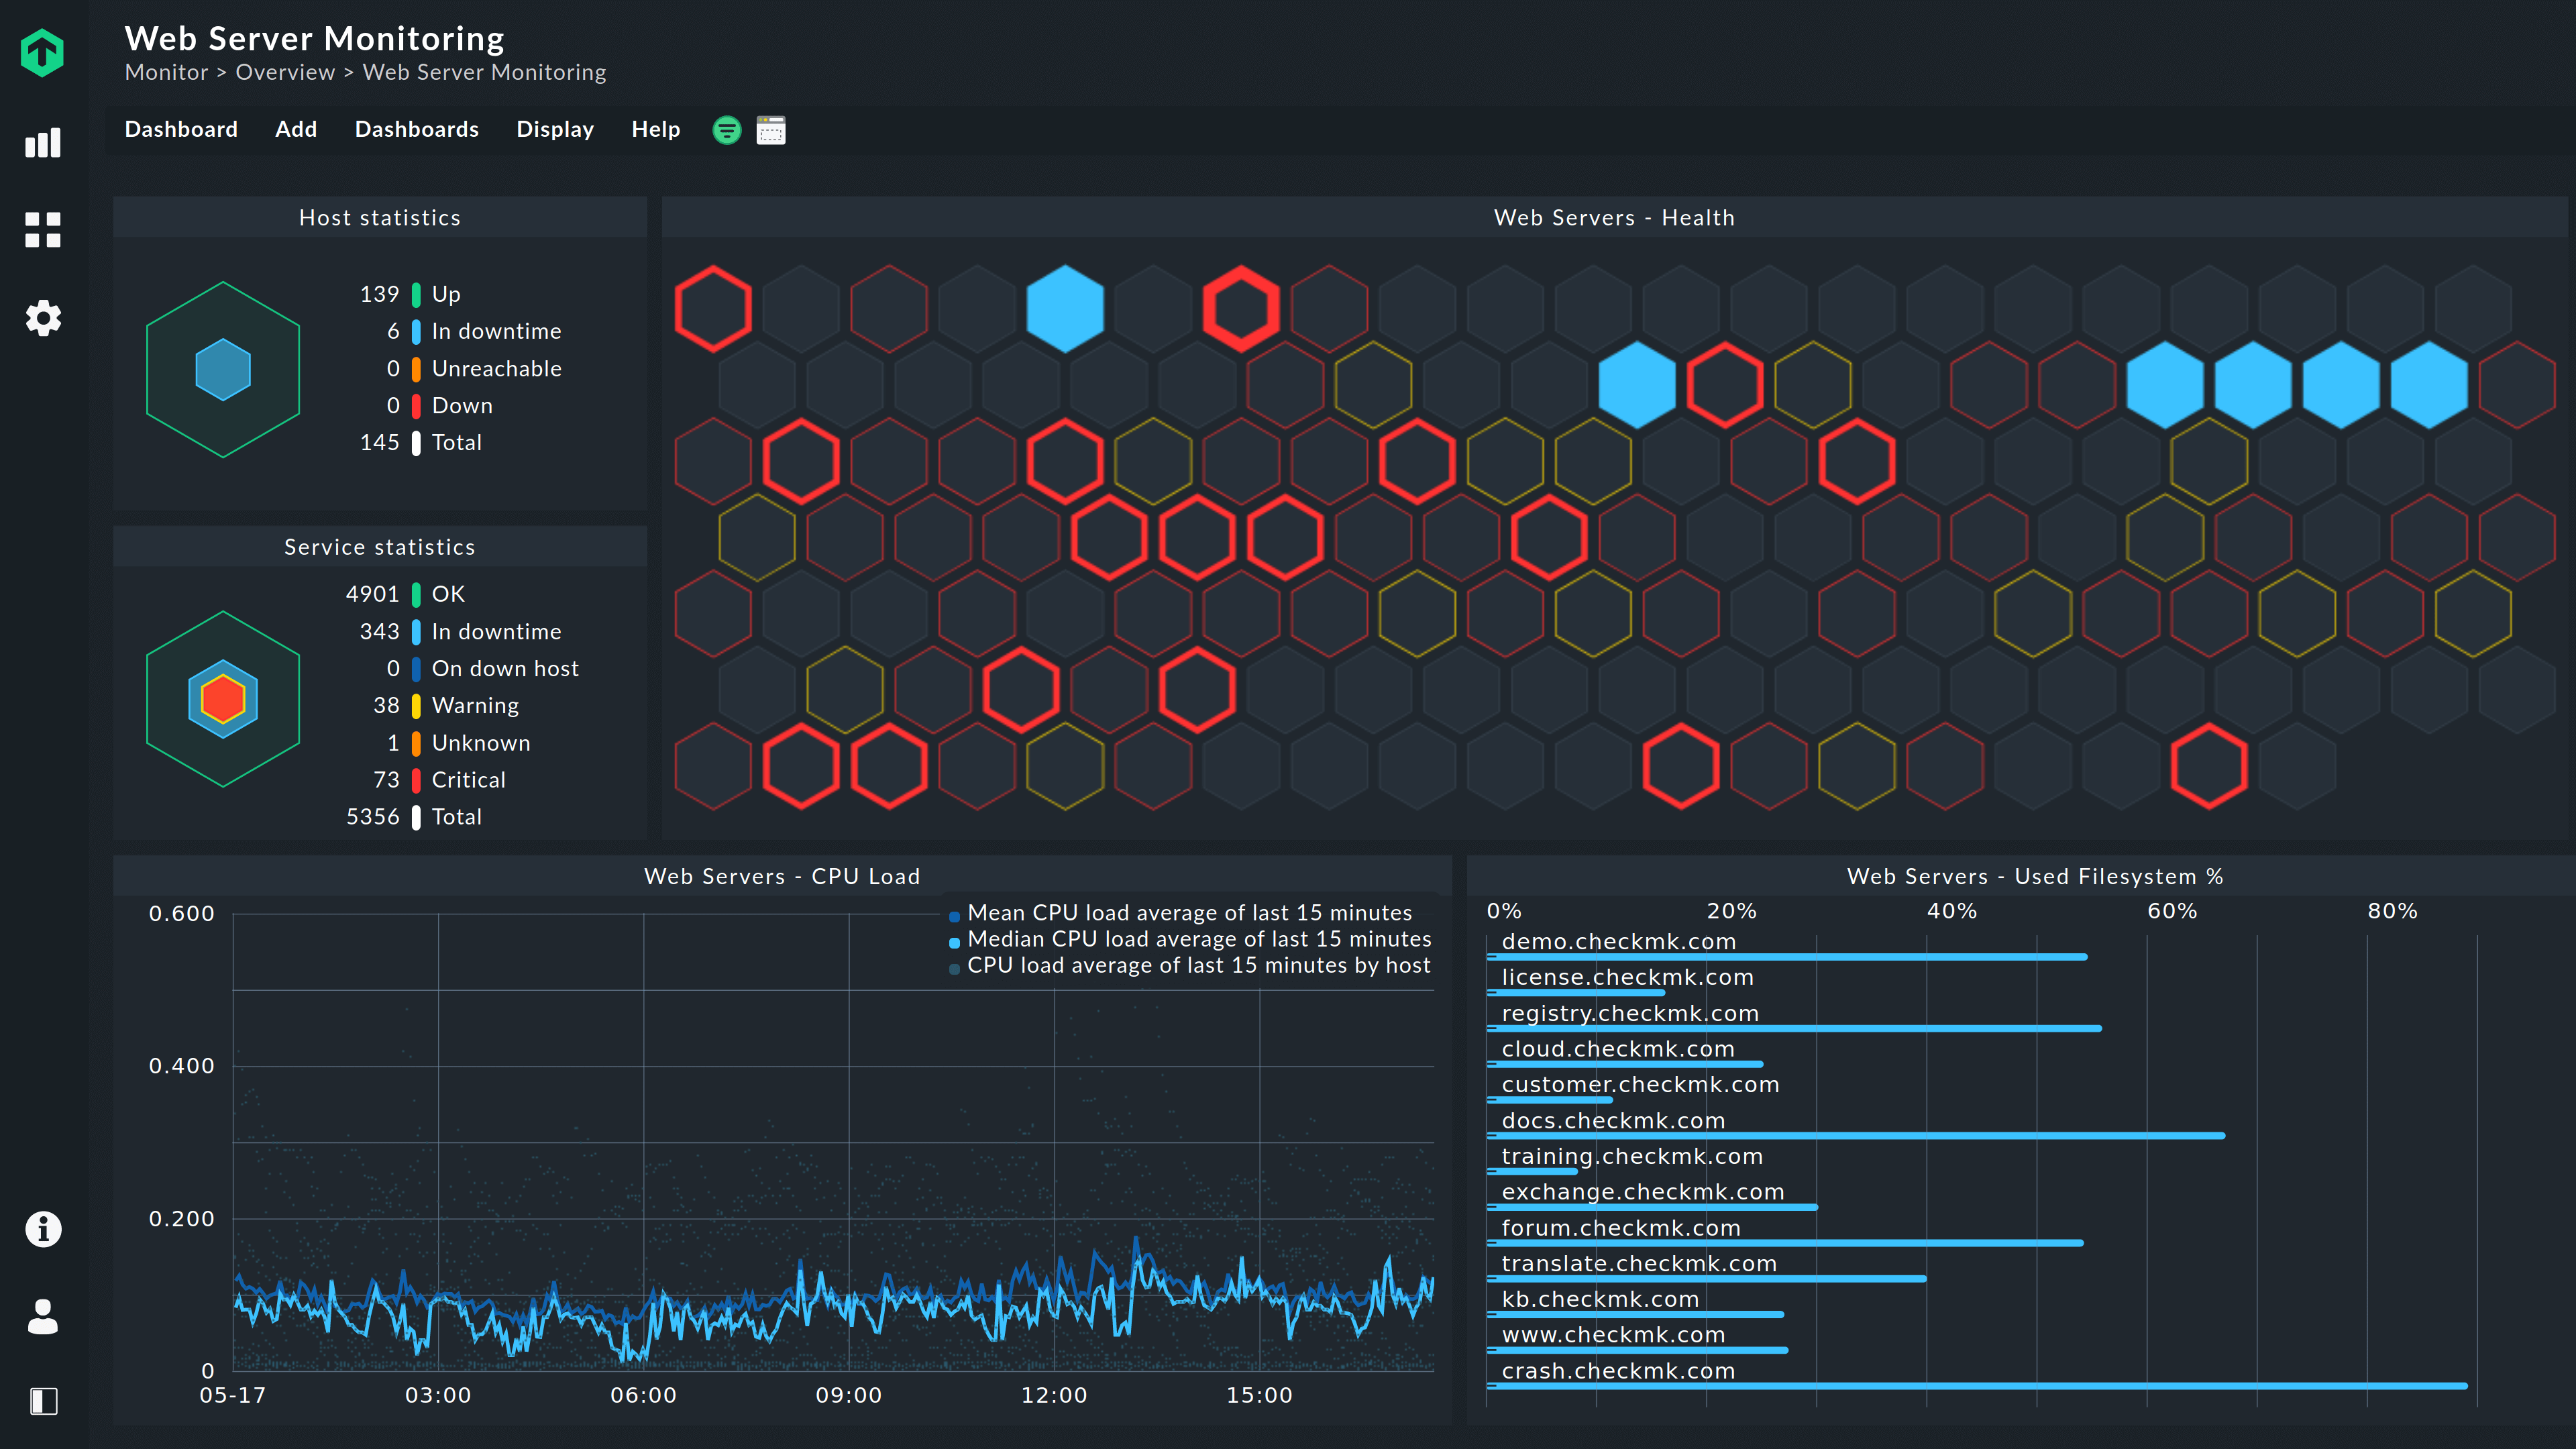

Containers
Get reliable insights into the performance and resource usage of your containers — and container orchestration platforms.
Enterprise-grade container monitoring for DevOps and IT Operations
Checkmk provides fast and reliable insights across all of your container and container orchestration platforms. Get an in-depth view into Docker, native Kubernetes and OpenShift Kubernetes performance and resource usage.
Auto-discover and include labels from containers and orchestration platforms
Supported cloud platforms and vendors

Enterprise-grade container monitoring for containerized applications
Your IT environment is constantly evolving, and so is Checkmk. Combine the monitoring of more static on-premises infrastructure for server, networks and applications with the monitoring of the new, dynamic, and often cloud-based IT stacks – all in one place.
Checkmk enables you to keep track of your container environments in real-time and at scale:
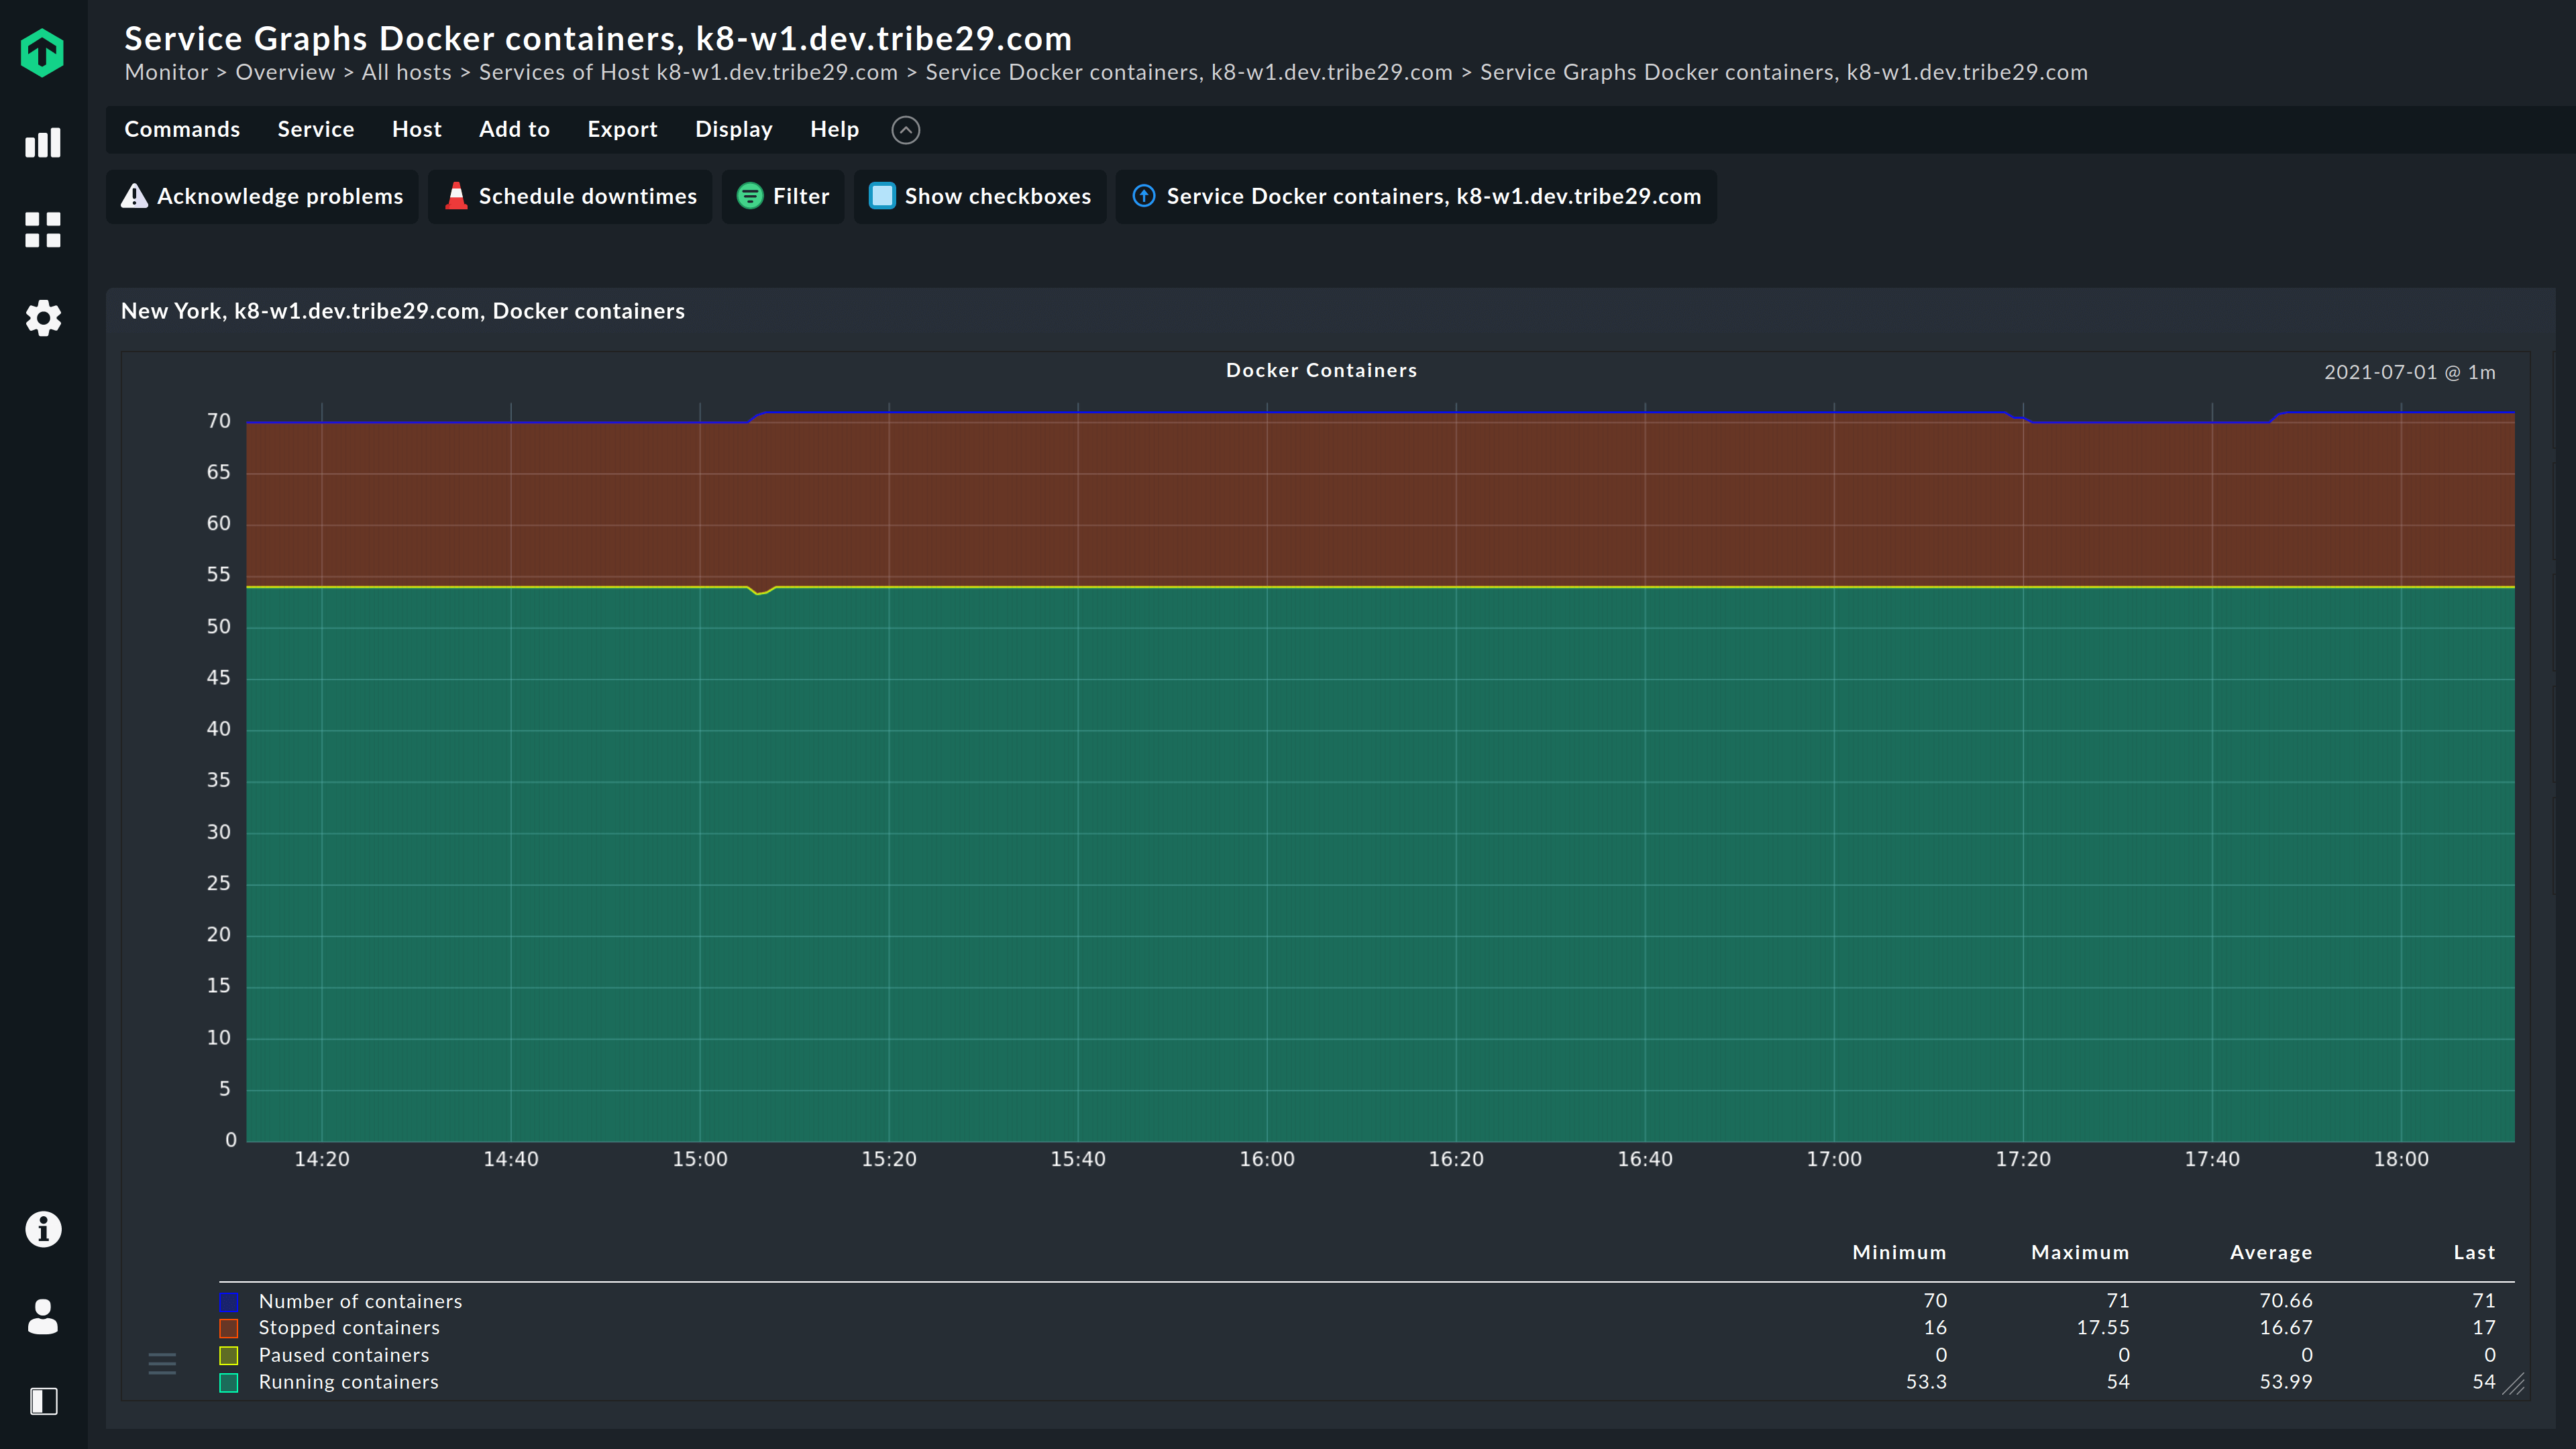
Monitor dynamic Docker environments
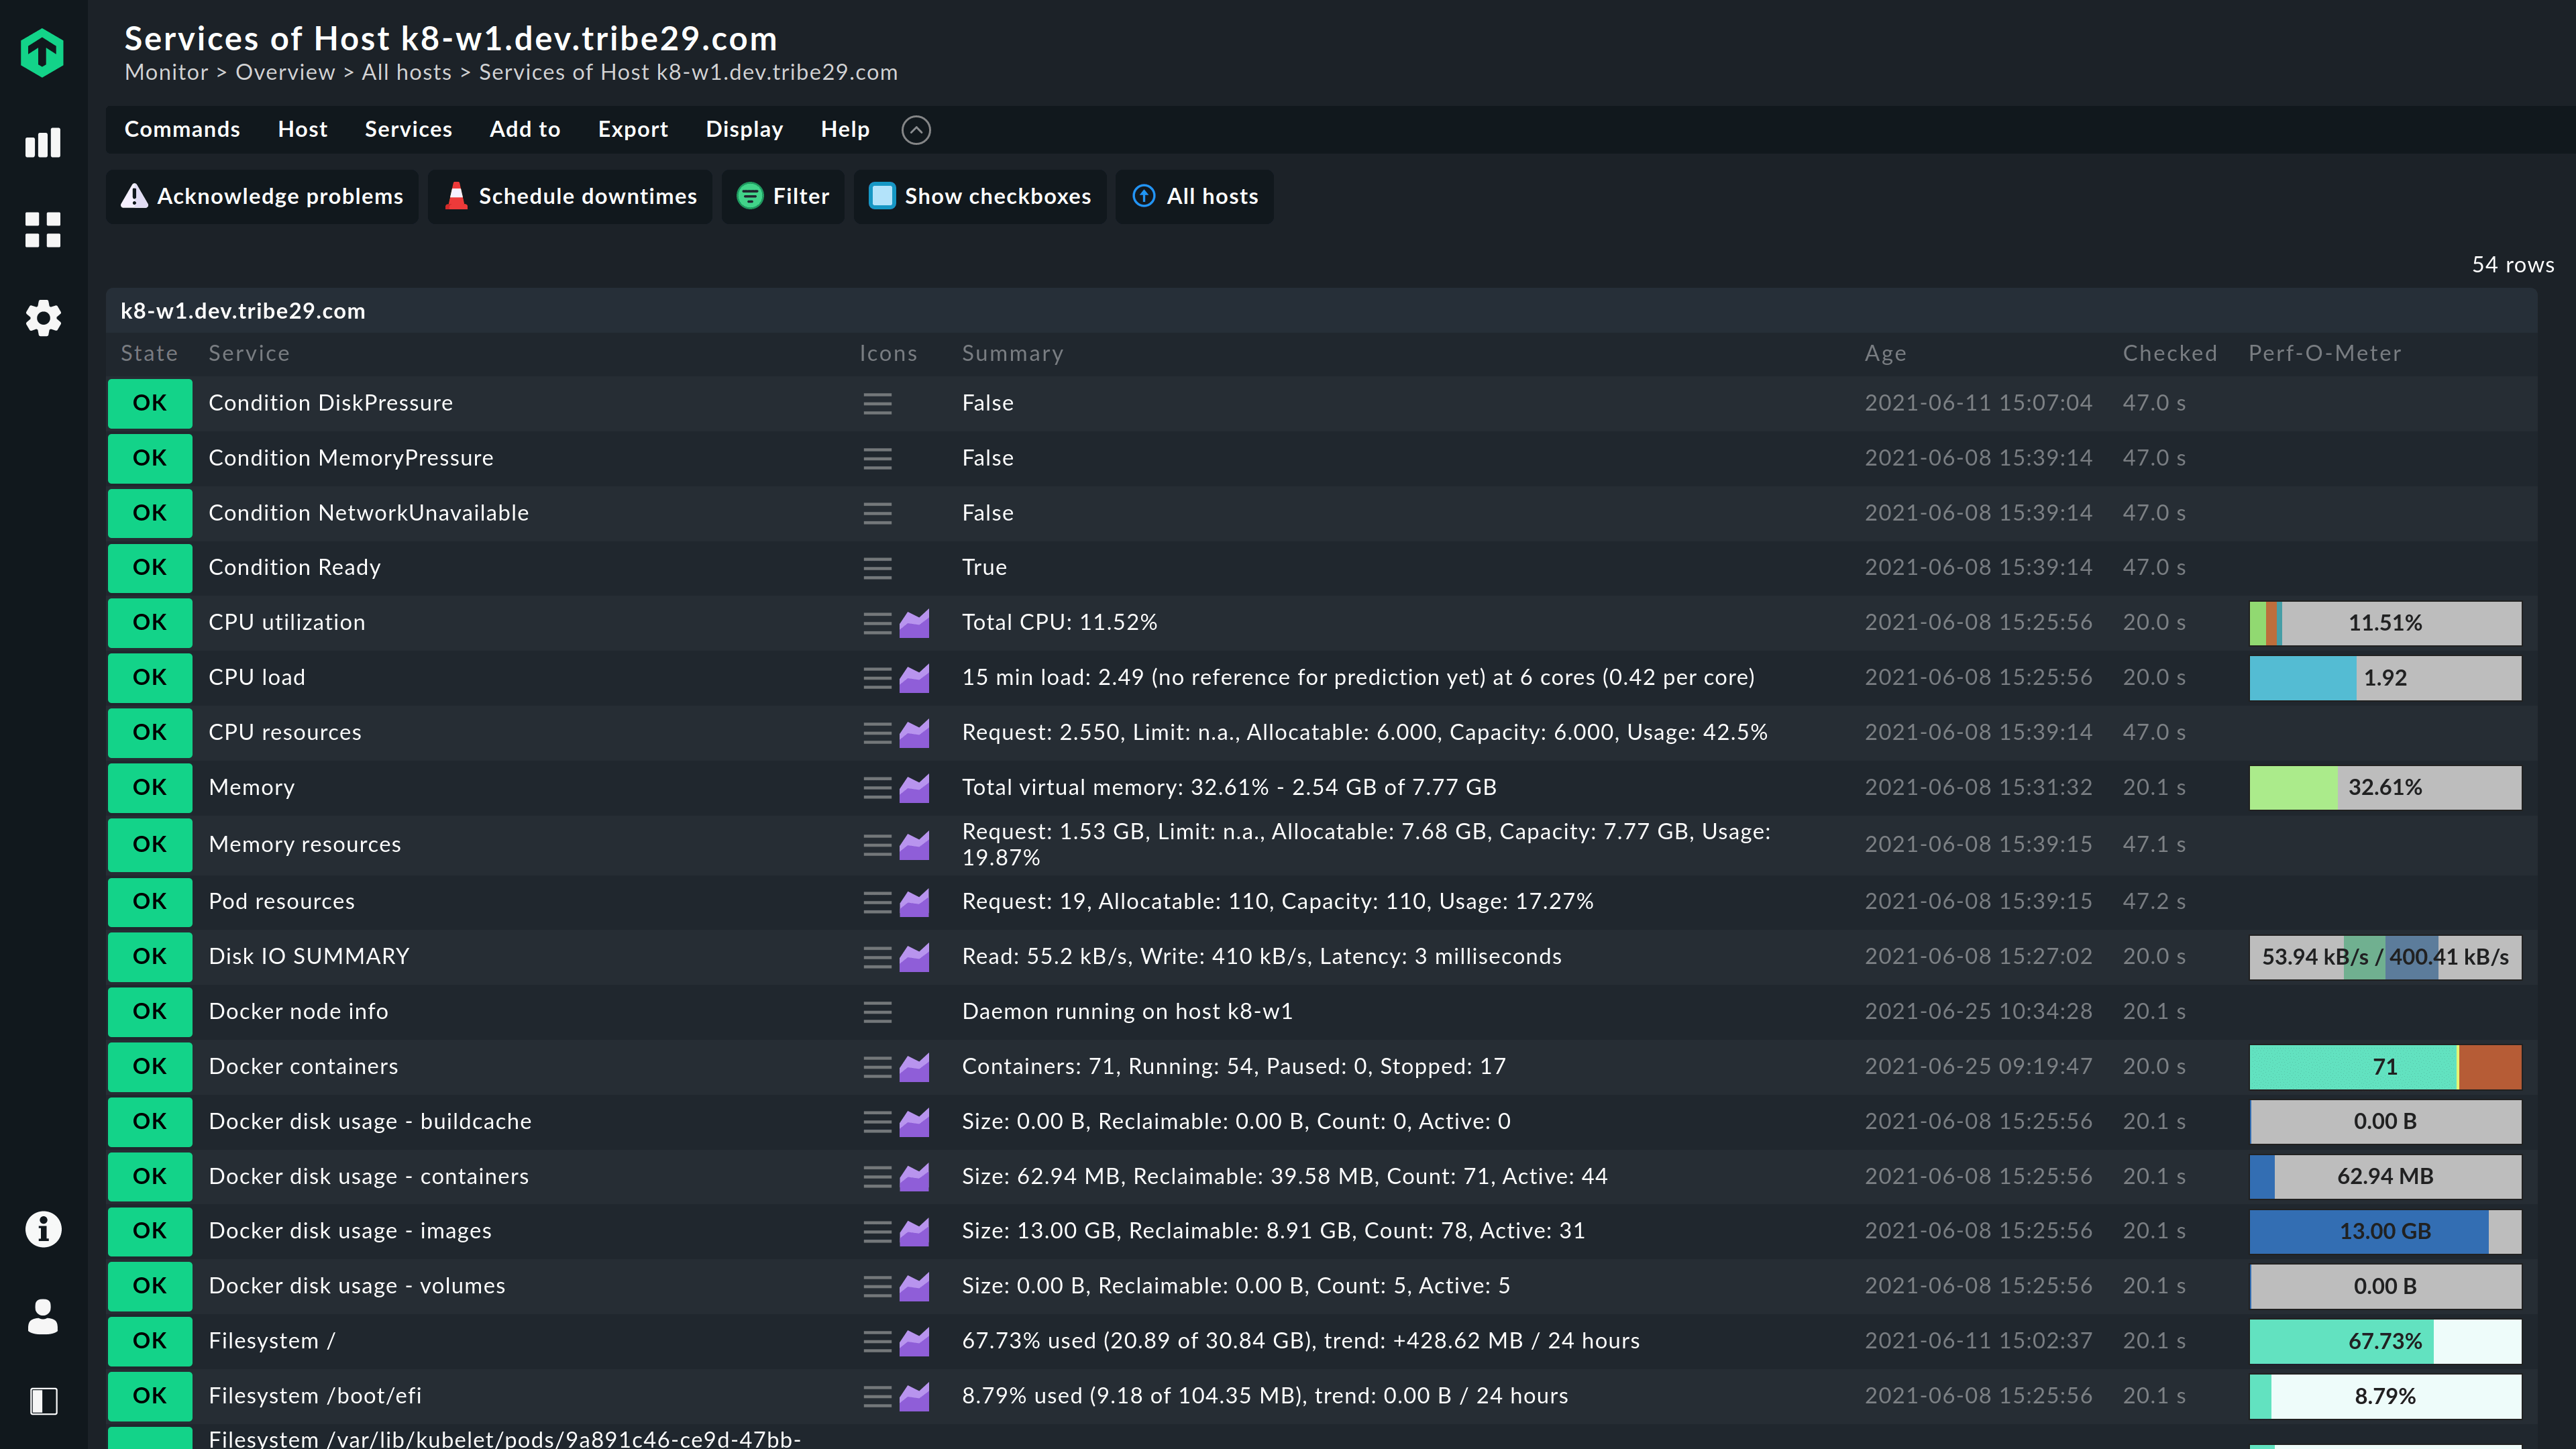 Easily track Docker containers and gain fully visibility into their real-time status and performance across Docker environments.
Leverage the new Docker monitoring plugin (mk_docker.py) using Docker’s Python-API to:
- Analyze Docker nodes, containers, and images and get detailed information about critical resource and performance metrics
- Build custom dashboards or use the Grafana integration to visualize key insights quickly
- Use root-cause analysis to reduce costly false alarms and address complex Docker problems
- Use historical data to understand how the changes in Docker topology, status and attributes impact system performance
Monitor dynamic Docker environments
Easily track Docker containers and gain fully visibility into their real-time status and performance across Docker environments.
Leverage the new Docker monitoring plugin (mk_docker.py) using Docker’s Python-API to:
- Analyze Docker nodes, containers, and images and get detailed information about critical resource and performance metrics
- Build custom dashboards or use the Grafana integration to visualize key insights quickly
- Use root-cause analysis to reduce costly false alarms and address complex Docker problems
- Use historical data to understand how the changes in Docker topology, status and attributes impact system performance

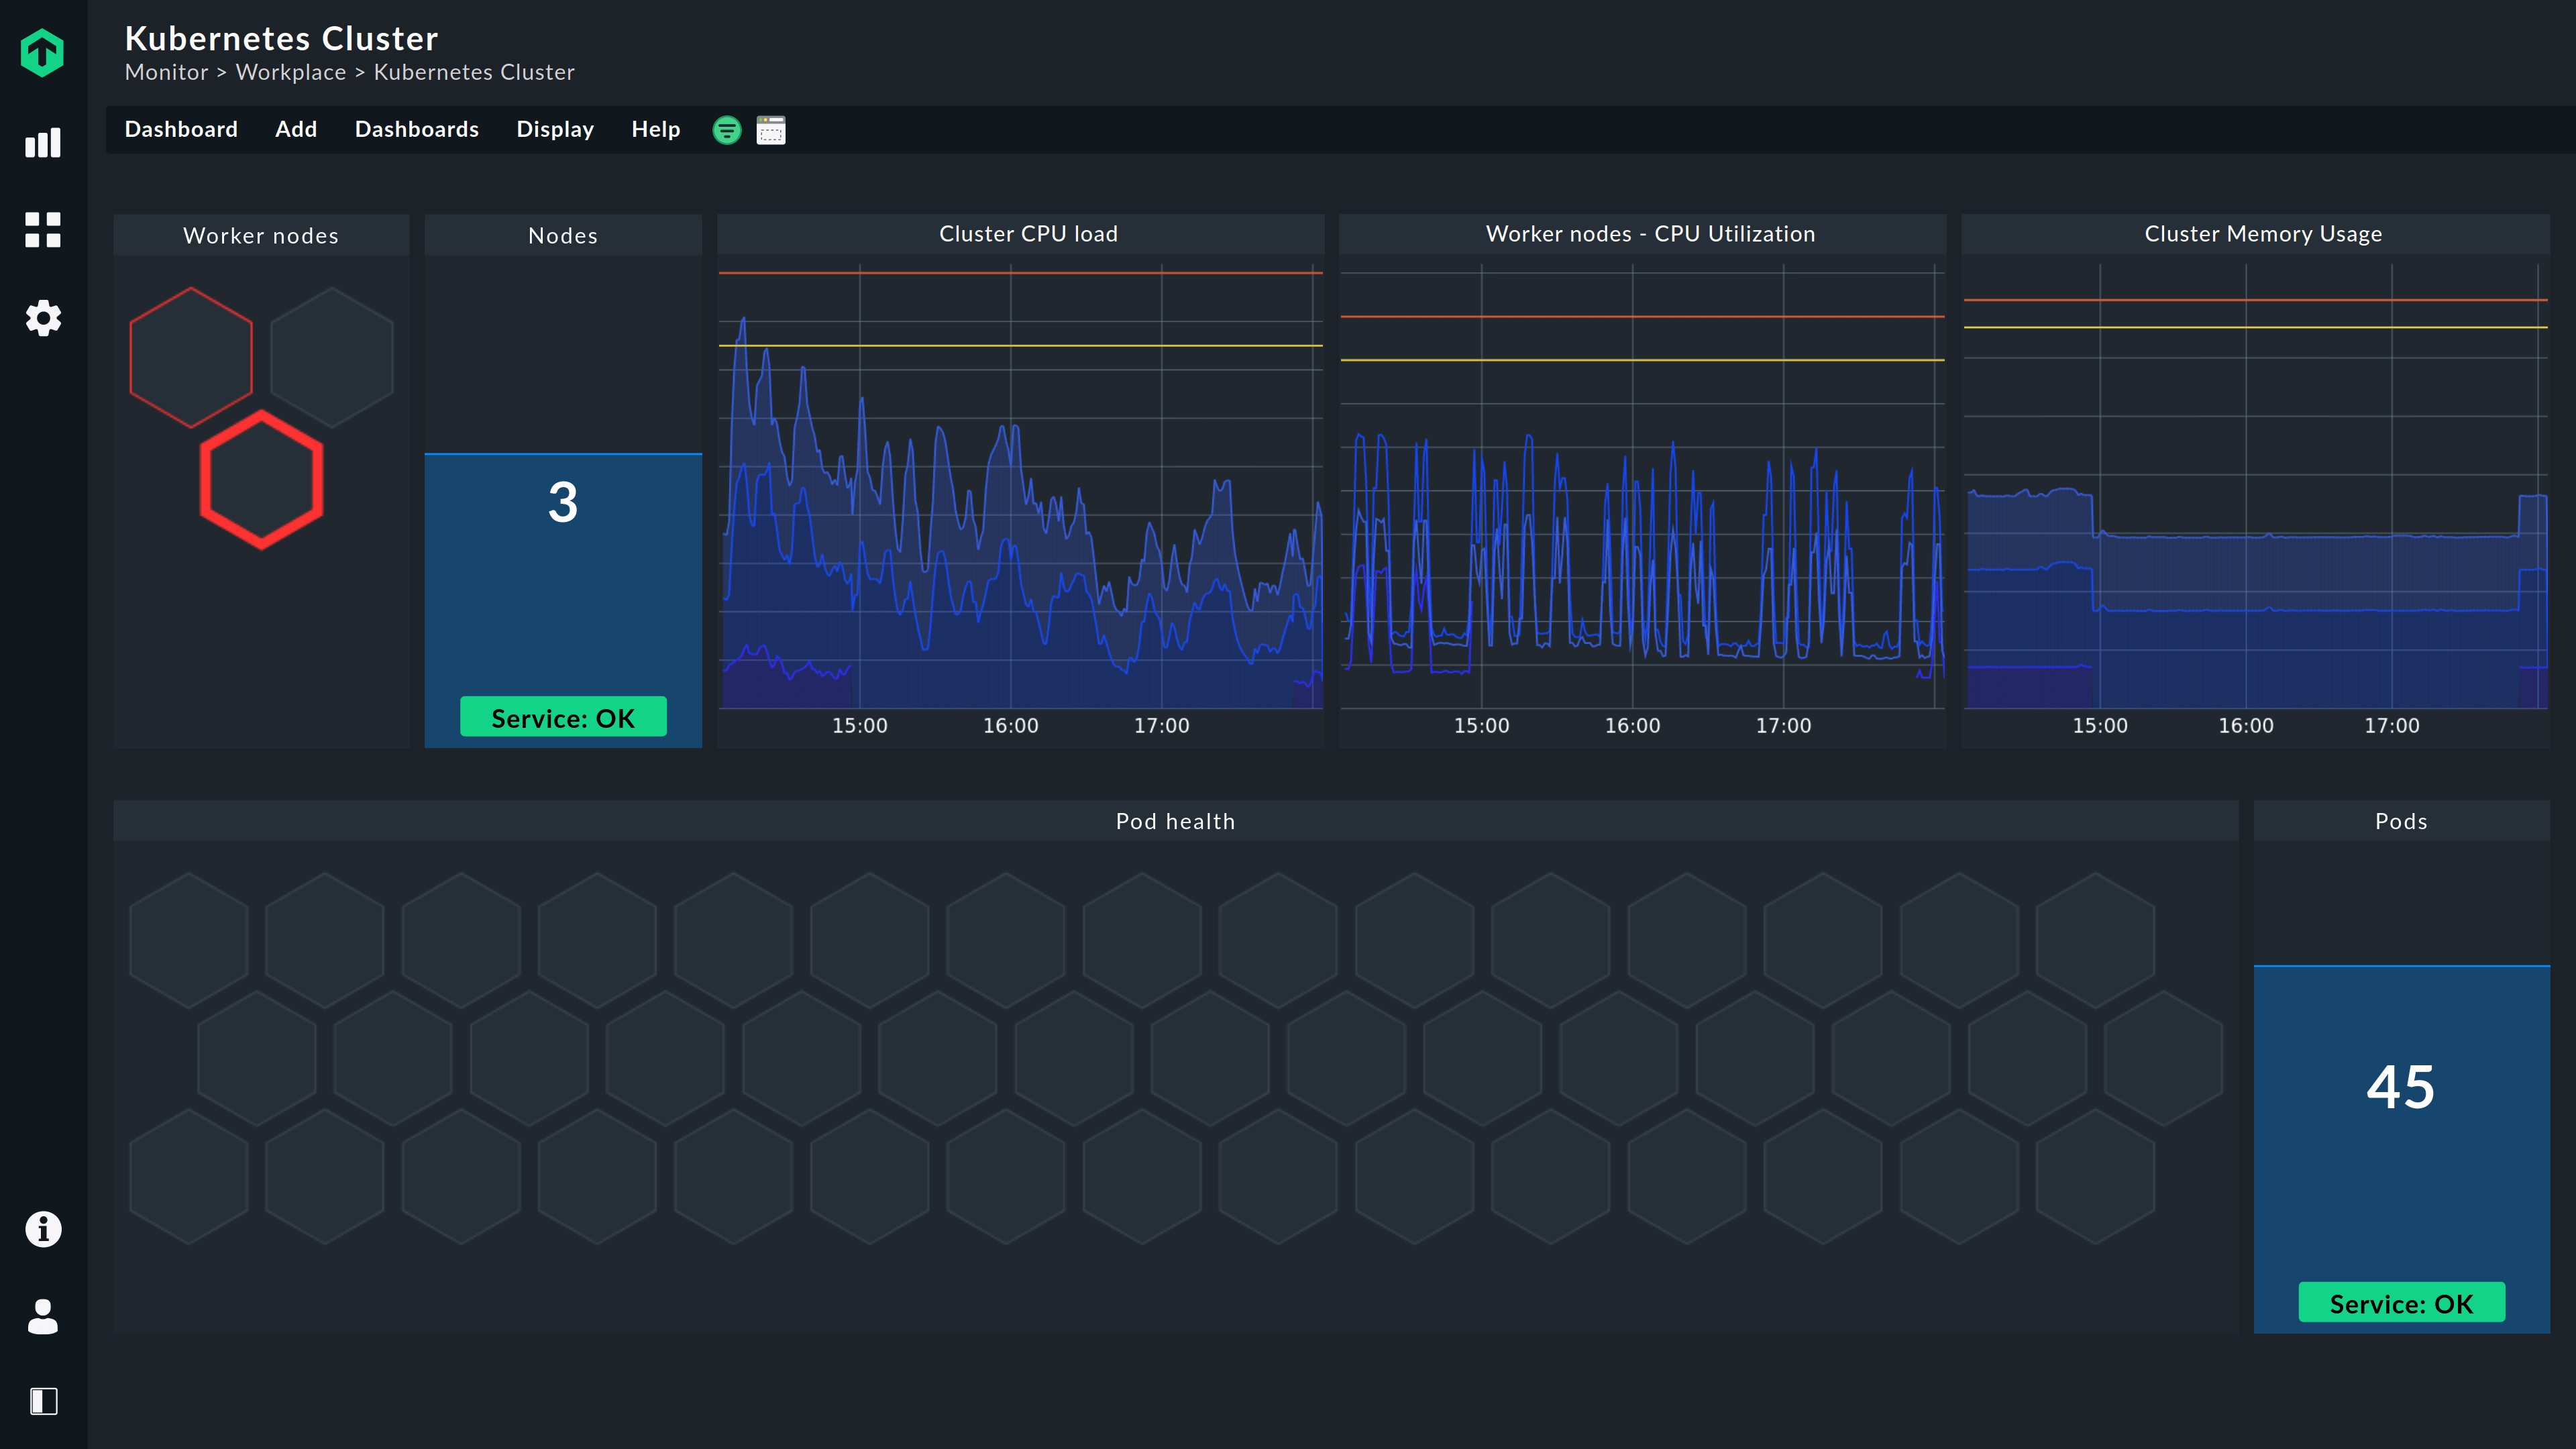
Kubernetes monitoring with Checkmk
Checkmk provides deep insights into your dynamic environments to ensure that everything is working as planned.
- Monitor namespaces, nodes, clusters and persistent volumes
- Monitor application-specific data (pods, deployments, services)
- Increase resource utilization efficiency with real-time monitoring
- Schedule and manage alerts across all Kubernetes clusters
- Leverage support for Prometheus adapters for your monitoring
- Create ‘real’ application views through Business Intelligence (BI) aggregations
- Monitor your Openshift environment beyond the current Kubernetes focus

Prometheus monitoring: Close the gap
If you already monitor your container environments with Prometheus, you have the problem that you cannot collect information about the underlying IT infrastructure. Therefore integrate your Prometheus monitoring system into Checkmk to monitor your IT infrastructure and fast moving container environments with one platform. Instead of having to check two monitoring systems, Checkmk allows you to correlate the data from both systems. Among other things, this facilitates a possible analysis of errors and their causes.
From version 1.6.0p12 on Checkmk enables the integration of the most important Prometheus exporters cAdvisor (Container Advisor), node_exporter and kube-state-metrics. It also offers the possibility to set up any metrics from Prometheus via a query in PromQL itself.
Through the integration in Checkmk the metrics from your Prometheus monitoring automatically get a meaningful context. For example, if Prometheus displays the amount of used memory correctly, you can use Checkmk to automatically see how much of the total available memory is used – without having to take any manual steps. The example shows that Checkmk can make your work easier already on a simple level and helps to close the gap between container monitoring with Prometheus and monitoring your IT infrastructure.
Prometheus monitoring: Close the gap
If you already monitor your container environments with Prometheus, you have the problem that you cannot collect information about the underlying IT infrastructure. Therefore integrate your Prometheus monitoring system into Checkmk to monitor your IT infrastructure and fast moving container environments with one platform. Instead of having to check two monitoring systems, Checkmk allows you to correlate the data from both systems. Among other things, this facilitates a possible analysis of errors and their causes.
From version 1.6.0p12 on Checkmk enables the integration of the most important Prometheus exporters cAdvisor (Container Advisor), node_exporter and kube-state-metrics. It also offers the possibility to set up any metrics from Prometheus via a query in PromQL itself.
Through the integration in Checkmk the metrics from your Prometheus monitoring automatically get a meaningful context. For example, if Prometheus displays the amount of used memory correctly, you can use Checkmk to automatically see how much of the total available memory is used – without having to take any manual steps. The example shows that Checkmk can make your work easier already on a simple level and helps to close the gap between container monitoring with Prometheus and monitoring your IT infrastructure.

Storage
Monitor the hardware and software aspects of your storage systems to manage capacity and respond to failures.
Storage Monitoring with Checkmk
Identify storage performance bottlenecks with ease, and improve your capacity planning.
Some of the vendors Checkmk support

Monitor HDDs, SSDs, NVMes and file systems
Monitor all your storage devices locally via native interfaces using the Checkmk agent and plug-ins. This provides S.M.A.R.T. throughput and usage values for the devices monitored. If the threshold values do not meet your requirements, you can easily configure your own standard values and exceptions.
Checkmk integrates Linux, Windows, ESXi, ZFS, Btrfs and many others, to intelligently monitor file systems and storage devices.
Use Checkmk to:
Checkmk’s rule-based system enables you to quickly define your own default configuration for monitoring new storage devices and file systems, without having to reconfigure them individually.
Network Attached Storage (NAS)
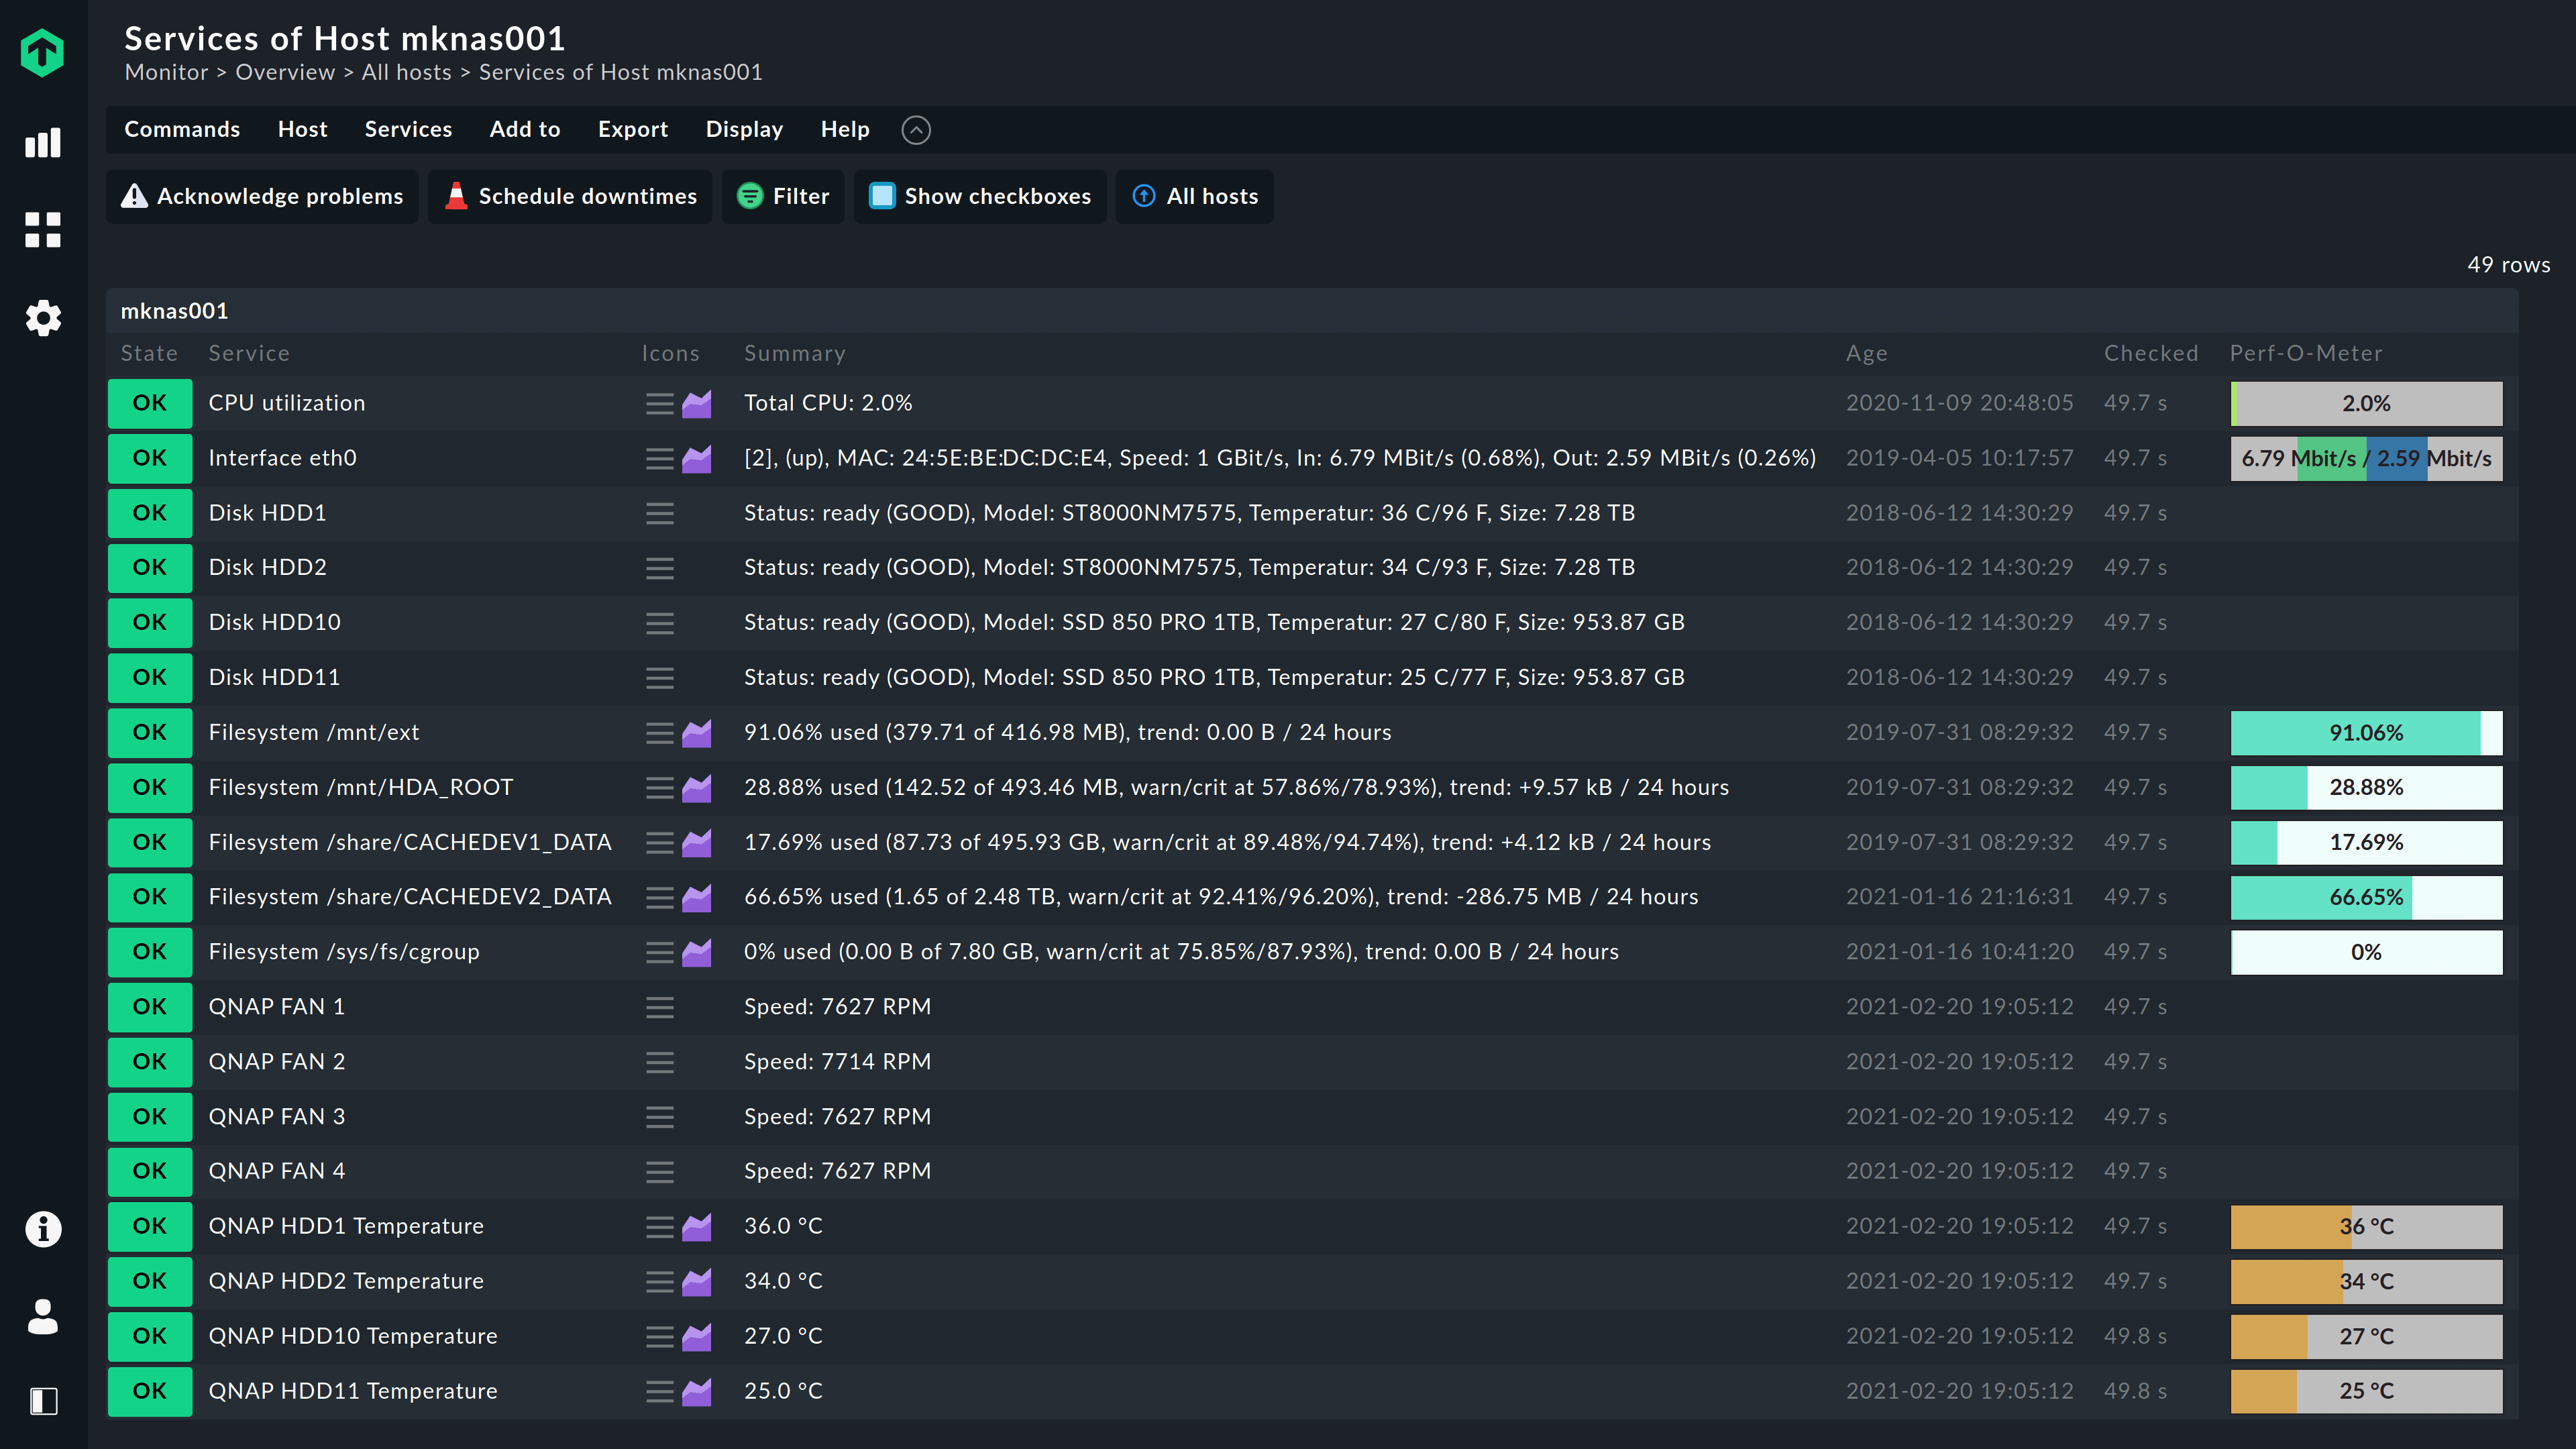
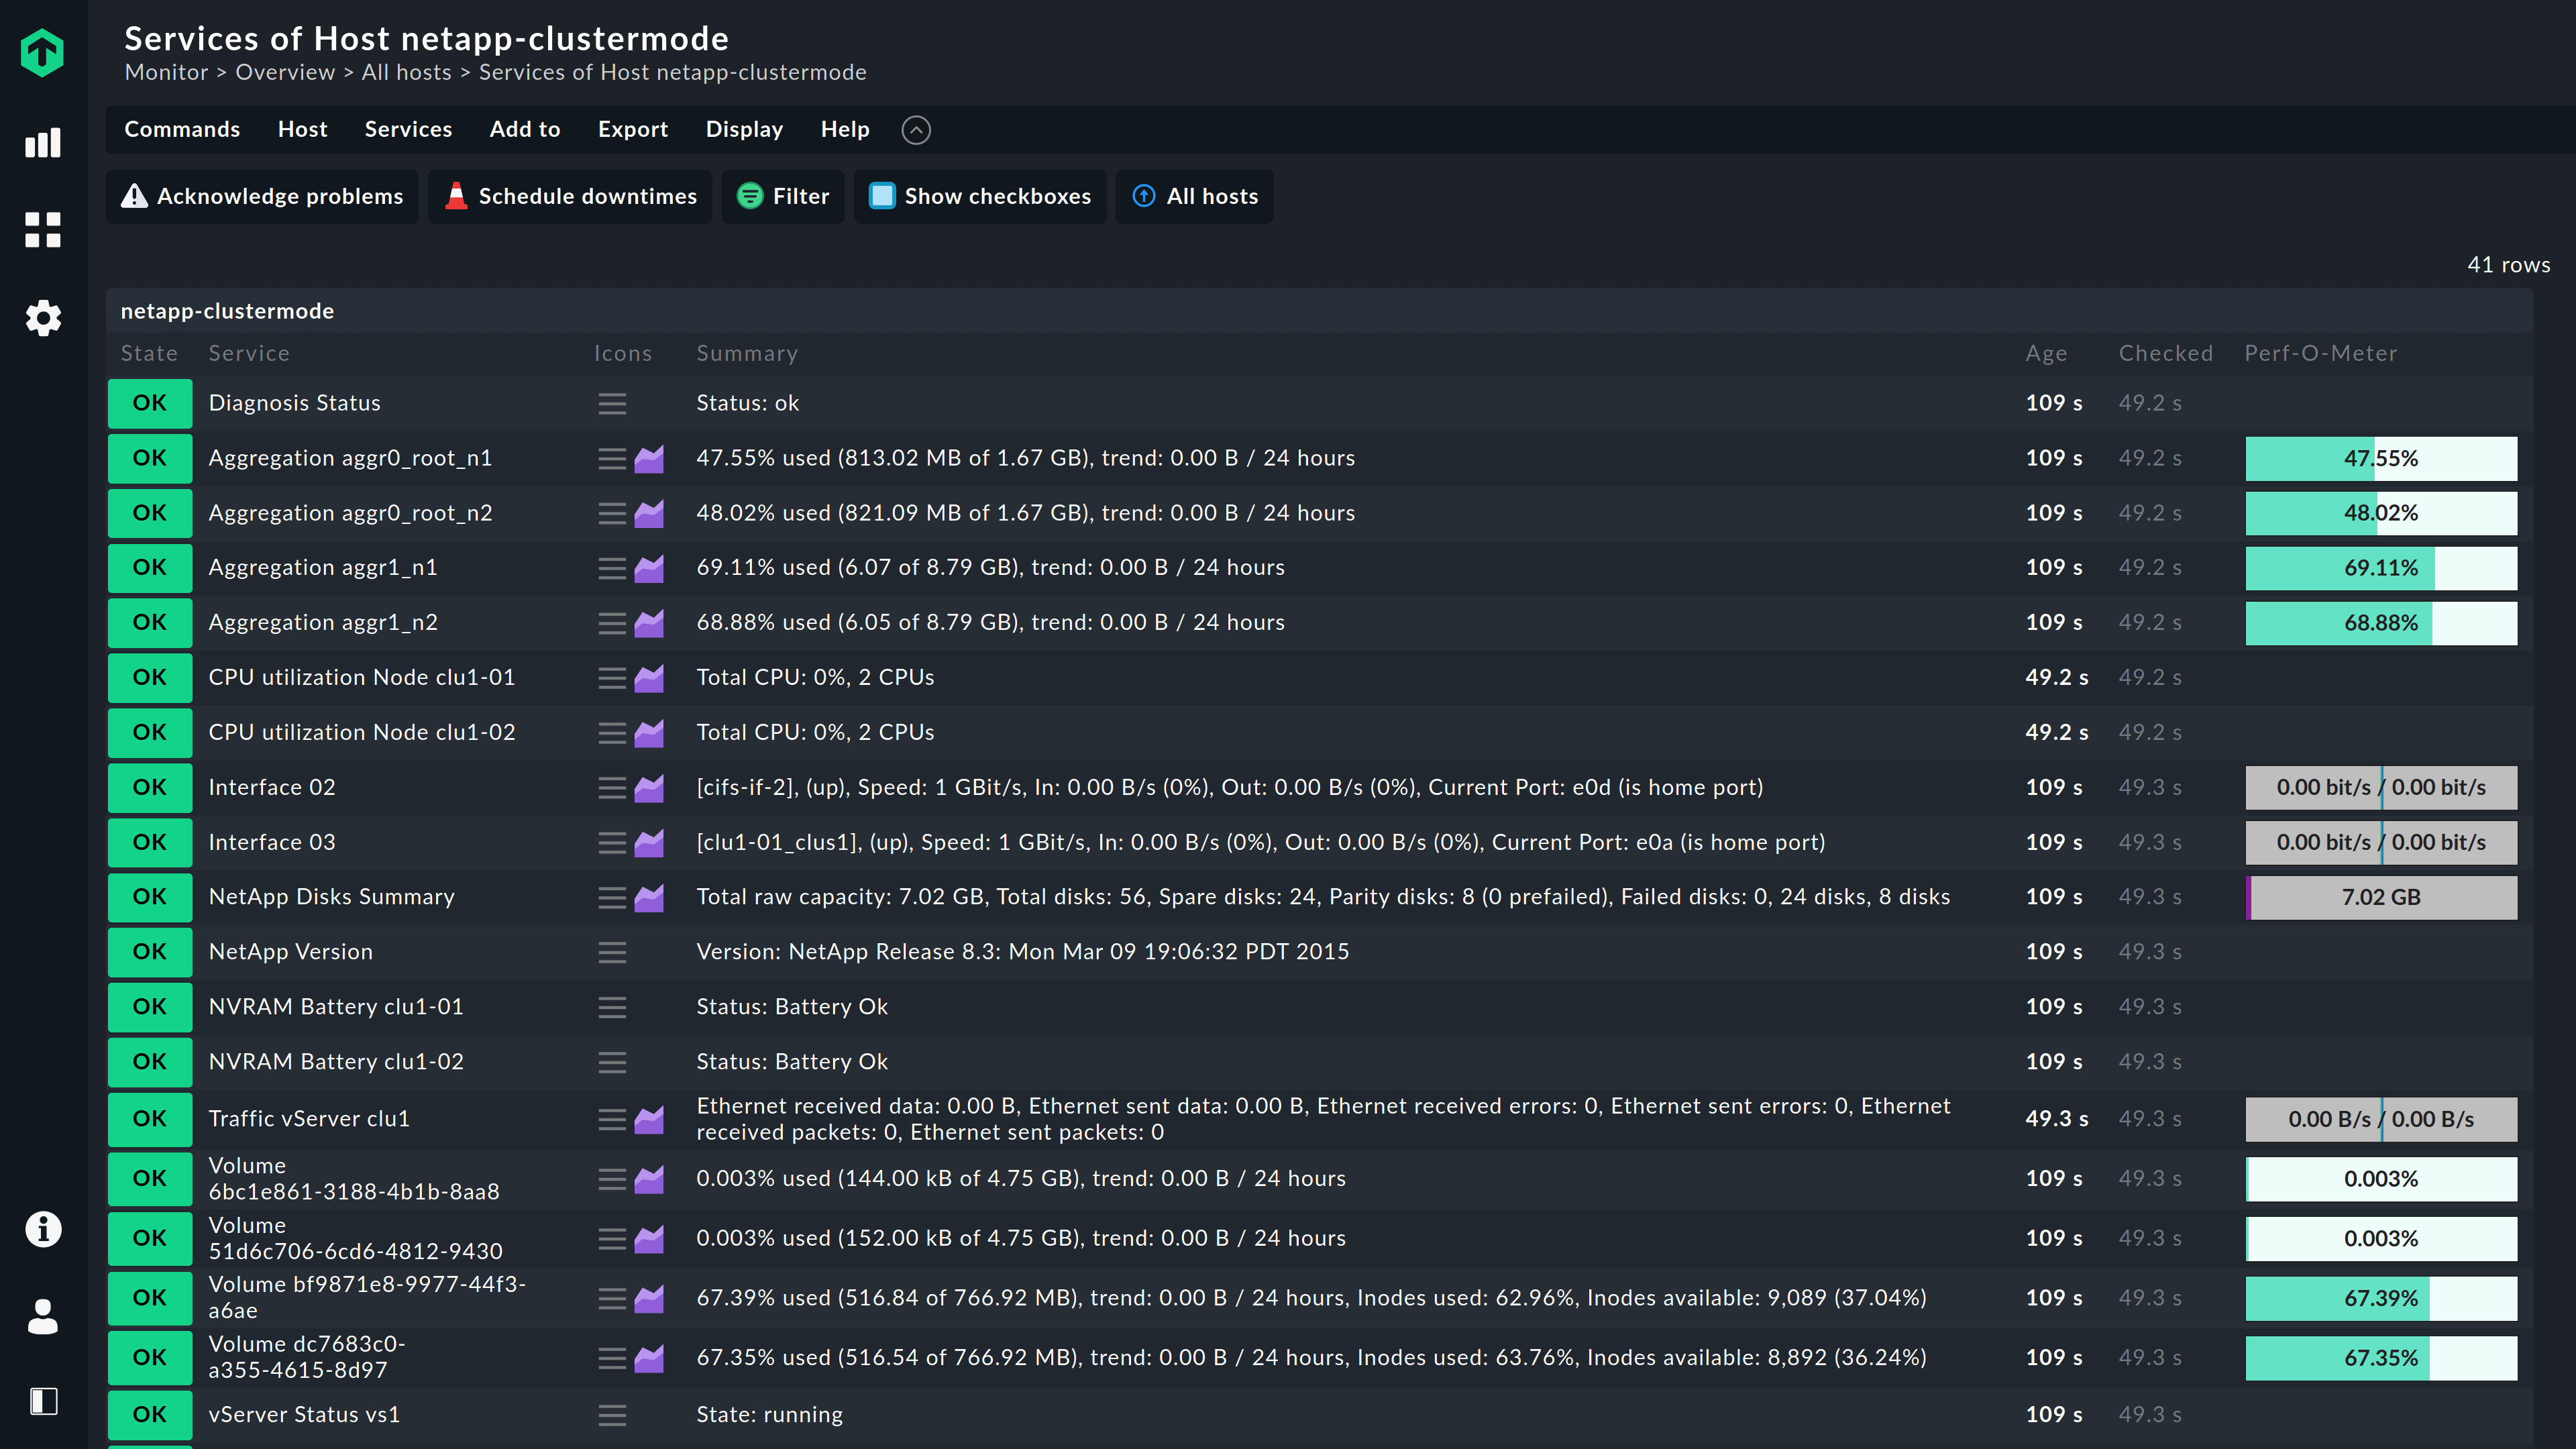
In addition to local storage devices, Checkmk also allows you to monitor all common file systems which are connected over the network. In this way you can monitor shares under Windows (Samba) or Linux (NFS), even if you do not have access to the servers that provide the shares.
You can also set up your NAS appliance, such as the Hitachi Network Attached Storage Platform, or storage solutions such as Synology and QNAP – via SNMP or another data source – and so keep track of all of your appliance hardware.

SANs, Storage Appliances, SDS and more
With Checkmk you can monitor all common storage providers without installing any additional extensions. Through the Checkmk agent you can directly monitor access to classic SAN systems without needing other plug-ins.
Performance analysis becomes easier, since all of your storage devices’ component metrics are being monitored in the same place. Checkmk also enables the monitoring of modern storage accesses and concepts:
- File systems provided by Ceph or ScaleIO have the same monitoring feature scope as other local file systems
- Other storage concepts, such as S3, are considered in detail in Checkmk and the check is adapted accordingly

Supported vendors
Internet of Things
Prevent downtime by keeping track of potential hazards in your server rooms and data centers.
IoT Monitoring with Checkmk
Monitor all major hazards in your IT rooms and data centers and understand the current state of your smart building, smart energy systems, IoT devices and much more.
Some of the vendors Checkmk support

What IoT environment monitoring is possible with Checkmk?
Supported applications and more


